Latest Post
Showing posts with label EARTH QUAKES NEWS. Show all posts

Many older adults still homebound after 2011 Great East Japan Earthquake

Written By Unknown on Thursday, October 30, 2014 | 1:20 AM

2011 Great East Japan Earthquake
A new study, published online in the journal Age and Ageing, shows that the homebound status of adults over the age of 65 in the aftermath of the 2011 Great East Japan Earthquake is still a serious public health concern. Of 2,327 older adults surveyed, approximately 20% were found to be homebound.

A team of researchers led by Naoki Kondo of the University of Tokyo's School of Public Health studied data from the city of Rikuzentakata, an area that was seriously damaged by the disaster. Of its total population of 23,302 before the events of 2011, 1,773 people died or are still missing. Of 7,730 houses, 3,368 (43.6%) were affected with 3,159 "completely destroyed." Much of the population had been concentrated in flat coastal areas, and since the community infrastructure was totally shattered, many people who lost their houses insisted on moving to areas in the mountains.

This study used home-visit interviews with 2,327 adults over 65 years old (1027 men; 1300 women), and was carried out between August 2012 and October 2013. Interviewers gathered information of current morbidity, socio-economic status, health behaviour (diet, smoking, and alcohol intake), frequency of going out, and social support. 19.6% of men and 23.2% of women were shown to be homebound, defined as only leaving the house every 4 or more days. Of those older adults who were classified as homebound, around 40% also had no contact with neighbours.

Information was also obtained on the locations of grocery stores, convenience stores, and shopping centres from the online community directory database in August 2012. Information on shopper bus stops and hawker sites was provided by a disaster support team, and the team also collated road network data. This geographical analysis indicated that distances to retail stores was associated with the risk of people being homebound.

Lead author Naoki Kondo says: "This study has important implications for public health, especially in the setting of post-disaster community reconstruction. First, community diagnoses in a post-disaster setting should cover the built environment, including access to shopping facilities. Second, to prevent older victims of a disaster such as the Great East Japan Earthquake being homebound, it is clearly essential to provide access to the facilities that fulfil their daily needs.

"Given the findings of this study, such access could be increased by the private sector, suggesting the importance of public-private partnerships for post-disaster reconstruction."

Key messages:
  • The homebound status of older victims of the 2011 Great East Japan Earthquake is a matter of public health concern
  • Geographical analysis indicated that distances to retail stores was associated with the risk of people being homebound
  • Hawker and shopping bus services contributed to improved access, providing more opportunities for going out

Source: Oxford University Press (OUP)

The Evidence of super-fast deep earthquake: Rare high-speed rupture off Russia and similar phenomena on shallow fault zones

Written By Unknown on Wednesday, October 29, 2014 | 10:08 PM

The supershear 2013 Sea of Okhotsk earthquake had similar magnitude and fault geometry as the damaging 1994 Northridge earthquake in California, but a much larger depth and faster rupture speed. The high rupture speed (approximately 8 kilometers per second, or 18,000 miles per hour) away from the hypocenter, shown as the red star, concentrates strong shaking on the "Mach front." Credit: Image courtesy of University of California - San Diego
As scientists learn more about earthquakes that rupture at fault zones near the planet's surface -- and the mechanisms that trigger them -- an even more intriguing earthquake mystery lies deeper in the planet.

Scientists at Scripps Institution of Oceanography at UC San Diego have discovered the first evidence that deep earthquakes, those breaking at more than 400 kilometers (250 miles) below Earth's surface, can rupture much faster than ordinary earthquakes. The finding gives seismologists new clues about the forces behind deep earthquakes as well as fast-breaking earthquakes that strike near the surface.

Seismologists have documented a handful of these events, in which an earthquake's rupture travels faster than the shear waves of seismic energy that it radiates. These "supershear" earthquakes have rupture speeds of four kilometers per second (an astonishing 9,000 miles per hour) or more.

In a National Science Foundation-funded study reported in the June 11, 2014, issue of the journal Science, Scripps geophysicists Zhongwen Zhan and Peter Shearer of Scripps, along with their colleagues at Caltech, discovered the first deep supershear earthquake while examining the aftershocks of a magnitude 8.3 earthquake on May 24, 2013, in the Sea of Okhotsk off the Russian mainland.
Details of a magnitude 6.7 aftershock of the event captured Zhan's attention. Analyzing data from the IRIS (Incorporated Research Institutions for Seismology) consortium, which coordinates a global network of seismological instruments, Zhan noted that most seismometers around the world yielded similar records, all suggesting an anomalously short duration for a magnitude 6.7 earthquake.
Data from one seismometer, however, stationed closest to the event in Russia's Kamchatka Peninsula, told a different story with intriguing details.

After closely analyzing the data, Zhan not only found that the aftershock ruptured extremely deeply at 640 kilometers (400 miles) below Earth's surface, but its rupture velocity was extraordinary -- about eight kilometers per second (five miles per second), nearly 50 percent faster than the shear wave velocity at that depth.

"For a 6.7 earthquake you would expect a duration of seven to eight seconds, but this one lasted just two seconds," said Shearer, a geophysics professor in the Cecil H. and Ida M. Green Institute of Geophysics and Planetary Physics (IGPP) at Scripps. "This is the first definitive example of supershear rupture for a deep earthquake since previously supershear ruptures have been documented only for shallow earthquakes."

"This finding will help us understand why deep earthquakes happen," said Zhan. "One quarter of earthquakes occur at large depths, and some of these can be pretty big, but we still don't understand why they happen. So this earthquake provides a new observation for deep earthquakes and high-rupture speeds."

Zhan also believes the new information will be useful in examining ultra-fast earthquakes and their potential for impacting fault zones near Earth's surface. Although not of supershear caliber, California's destructive 1994 Northridge earthquake had a comparable size and geometry to that of the 6.7 Sea of Okhotsk aftershock.

"If a shallow earthquake such as Northridge goes supershear, it could cause even more shaking and possibly more damage," said Zhan.

Source: University of California - San Diego

New bridge design improves earthquake resistance, reduces damage and speeds construction

This graphic illustrates a new design for the framework of columns and beams that support bridges, called "bents," to improve performance for better resistance to earthquakes, less damage and faster on-site construction. The faster construction is achieved by prefabricating the columns and beams off site and later erecting and connecting them quickly at the construction site. Credit: University of Washington, Seattle/NEES photo
Researchers have developed a new design for the framework of columns and beams that support bridges, called "bents," to improve performance for better resistance to earthquakes, less damage and faster on-site construction.

The faster construction is achieved by pre-fabricating the columns and beams off-site and shipping them to the site, where they are erected and connected quickly.

"The design of reinforced concrete bridges in seismic regions has changed little since the mid-1970s," said John Stanton, a professor in the Department of Civil and Environmental Engineering at the University of Washington, Seattle, who developed the concept underlying the new design. The team members include professor Marc Eberhard and graduate research assistants Travis Thonstad and Olafur Haraldsson from the University of Washington; and professor David Sanders and graduate research assistant Islam Mantawy from the University of Nevada, Reno.

Research findings are included in a paper being presented during Quake Summit 2014, the annual meeting for the National Science Foundation's George E. Brown, Jr. Network for Earthquake Engineering Simulation, a shared network of laboratories based at Purdue University. This year's summit is part of the 10th U.S. National Conference on Earthquake Engineering on July 21-25 in Anchorage, Alaska.

Until now the majority of bridge bents have been made using concrete that is cast in place, but that approach means time is needed for the concrete to gain strength before the next piece can be added. Pre-fabricating the pieces ahead of time eliminates this requirement, speeding on-site construction and reducing traffic delays.

"However, pre-fabricating means the pieces need to be connected on-site, and therein lies a major difficulty," Stanton said. "It is hard enough to design connections that can survive earthquake shaking, or to design them so that they can be easily assembled, but to do both at once is a real challenge."
Moreover, the researchers have achieved this goal using only common construction materials, which should smooth the way for owners and contractors to accept the new approach, he said.

An important feature of the new system is that the columns are pre-tensioned.

"A good analogy is to think of a series of a child's wooden building blocks, each with a hole through it," Stanton said. "Stack them on top of one another, put a rubber band through the central hole, stretch it tight and anchor it at each end. The rubber band keeps the blocks squeezed together. Now stand the assembly of blocks up on its end and you have a pre-tensioned column. If the bottom of the column is attached to a foundation block, you can push the top sideways, as would an earthquake, but the rubber band just snaps the column back upright when you let go."

This "re-centering" action is important because it ensures that, directly after an earthquake, the bridge columns are vertical and not leaning over at an angle. This means that the bridge can be used by emergency vehicles in the critical moments immediately following the earthquake.

"Of course, the real bridge columns do not contain rubber bands, but very high-strength steel cables are used to achieve the same behavior," Stanton said.

To keep the site operations as simple as possible, those cables are stressed and embedded in the concrete at the plant where the columns are fabricated. The columns also contain some conventional rebar, which is also installed in the fabrication plant.

The technology was pioneered in the building industry in the 1990s but is now being adapted for use with bridges.

When the columns rock during an earthquake, they experience high local stresses at the points of contact, and without special measures the concrete there would crush. To counteract this possibility, the researchers protected the ends of the columns with short steel tubes, or "jackets," that confine the concrete, not unlike the hoops of a barrel, or the steel cap that ranchers use to protect the top of a fence-post while driving it into the ground.

"Cyclic tests of the critical connections have demonstrated that the system can deform during strong earthquakes and then bounce back to vertical with minimal damage," Stanton said.

Those tests were conducted on individual connections by graduate assistants Olafur Haraldsson, Jeffrey Schaefer and Bryan Kennedy. In July, the team will test a complete bridge built with the system. The test will be conducted at 25 percent of full-scale on the earthquake-shaking tables at a facility at the University of Nevada, Reno. The facility is part of NEES.

Travis Thonstad led the design and built the components for that test. The column and cap beam components were then shipped to the University of Nevada, Reno, where Islam Mantawy is leading the construction of the bridge. The team from Washington and Nevada will be processing the data from this project, and it will be archived and made available to the public through NEES.

The Quake Summit paper was authored jointly by the team. The research was supported by the NSF, the Pacific Earthquake Engineering Research (PEER) Center and the Valle Foundation of the University of Washington.

Source: Purdue University

The Gas-charged fluids creating seismicity associated with a Louisiana sinkhole

Natural earthquakes and nuclear explosions produce seismic waves that register on seismic monitoring networks around the globe, allowing the scientific community to pinpoint the location of the events. In order to distinguish seismic waves produced by a variety of activities -- from traffic to mining to explosions -- scientists study the seismic waves generated by as many types of events as possible.

In August 2012, the emergence of a very large sinkhole at the Napoleonville Salt Dome in Louisiana offered University of California, Berkeley scientists the opportunity to detect, locate and analyze a rich sequence of 62 seismic events that occurred one day prior to its discovery.

In June 2012, residents of Bayou Corne reported frequent tremors and unusual gas bubbling in local surface water. The U.S. Geological Survey installed a temporary network of seismic stations, and on August 3, a large sinkhole was discovered close to the western edge of the salt dome.

In this study published by the Bulletin of the Seismological Society of America (BSSA), co-authors Douglas Dreger and Avinash Nayak, evaluated the data recorded by the seismic network during the 24 hours prior to the discovery of the sinkhole. They implemented a waveform scanning approach to continuously detect, locate and analyze the source of the seismic events at the sinkhole, which are located to the edge of the salt dome and above and to the west of the cavern near the sinkhole.

The point-source equivalent force system describing the motions at the seismic source (called moment tensor) showed similarities to seismic events produced by explosions and active geothermal and volcanic environments. But at the sinkhole, an influx of natural gas rather than hot magma may be responsible for elevating the pore pressure enough to destabilize pre-existing zones of weakness, such as fractures or faults at the edge of the salt dome.

Source: Seismological Society of America

The Extinct undersea volcanoes squashed under Earth's crust cause tsunami earthquakes

New research has revealed the causes and warning signs of rare tsunami earthquakes, which may lead to improved detection measures.

Tsunami earthquakes happen at relatively shallow depths in the ocean and are small in terms of their magnitude. However, they create very large tsunamis, with some earthquakes that only measure 5.6 on the Richter scale generating waves that reach up to ten metres when they hit the shore.

A global network of seismometers enables researchers to detect even the smallest earthquakes. However, the challenge has been to determine which small magnitude events are likely to cause large tsunamis.

In 1992, a magnitude 7.2 tsunami earthquake occurred off the coast of Nicaragua in Central America causing the deaths of 170 people. Six hundred and thirty seven people died and 164 people were reported missing following a tsunami earthquake off the coast of Java, Indonesia, in 2006, which measured 7.2 on the Richter scale.

The new study, published in the journal Earth and Planetary Science Letters, reveals that tsunami earthquakes may be caused by extinct undersea volcanoes causing a "sticking point" between two sections of Earth's crust called tectonic plates, where one plate slides under another.
The researchers from Imperial College London and GNS Science in New Zealand used geophysical data collected for oil and gas exploration and historical accounts from eye witnesses relating to two tsunami earthquakes, which happened off the coast of New Zealand's north island in 1947. Tsunami earthquakes were only identified by geologists around 35 years ago, so detailed studies of these events are rare.

The team located two extinct volcanoes off the coast of Poverty Bay and Tolaga Bay that have been squashed and sunk beneath the crust off the coast of New Zealand, in a process called subduction.
The researchers suggest that the volcanoes provided a "sticking point" between a part of Earth's crust called the Pacific plate, which was trying to slide underneath the New Zealand plate. This caused a build-up of energy, which was released in 1947, causing the plates to "unstick" and the Pacific plate to move and the volcanoes to become subsumed under New Zealand. This release of the energy from both plates was unusually slow and close to the seabed, causing large movements of the sea floor, which led to the formation of very large tsunami waves.

All these factors combined, say the researchers, are factors that contribute to tsunami earthquakes. The researchers say that the 1947 New Zealand tsunami earthquakes provide valuable insights into what geological factors cause these events. They believe the information they've gathered on these events could be used to locate similar zones around the world that could be at risk from tsunami earthquakes. Eyewitnesses from these tsunami earthquakes also describe the type of ground movement that occurred and this provides valuable clues about possible early warning signals for communities.

Dr Rebecca Bell, from the Department of Earth Science and Engineering at Imperial College London, says: "Tsunami earthquakes don't create massive tremors like more conventional earthquakes such as the one that hit Japan in 2011, so residents and authorities in the past haven't had the same warning signals to evacuate. These types of earthquakes were only identified a few decades ago, so little information has been collected on them. Thanks to oil exploration data and eyewitness accounts from two tsunami earthquakes that happened in New Zealand more than 70 years ago, we are beginning to understand for first time the factors that cause these events. This could ultimately save lives."

By studying the data and reports, the researchers have built up a picture of what happened in New Zealand in 1947 when the tsunami earthquakes hit. In the March earthquake, eyewitnesses around Poverty Bay on the east coast of the country, close to the town of Gisborne, said that they didn't feel violent tremors, which are characteristic of typical earthquakes. Instead, they felt the ground rolling, which lasted for minutes, and brought on a sense of sea sickness. Approximately 30 minutes later the bay was inundated by a ten metre high tsunami that was generated by a 5.9 magnitude offshore earthquake. In May, an earthquake measuring 5.6 on the Richter scale happened off the coast of Tolaga Bay, causing an approximate six metre high tsunami to hit the coast. No lives were lost in the New Zealand earthquakes as the areas were sparsely populated in 1947. However, more recent tsunami earthquakes elsewhere have devastated coastal communities.

The researchers are already working with colleagues in New Zealand to develop a better warning system for residents. In particular, new signage is being installed along coastal regions to alert people to the early warning signs that indicate a possible tsunami earthquake. In the future, the team hope to conduct new cutting-edge geophysical surveys over the sites of other sinking volcanoes to better understand their characteristics and the role they play in generating this unusual type of earthquake.

Source: Imperial College London

The Deep Earth recycling of the oceanic floor: New insight into the temperature of deep Earth

Scientists from the Magma and Volcanoes Laboratory (CNRS/IRD/Universitรฉ Blaise Pascal) and the European Synchrotron, the ESRF, have recreated the extreme conditions 600 to 2900 km below Earth's surface to investigate the melting of basalt in the oceanic tectonic plates. They exposed microscopic pieces of rock to these extreme pressures and temperatures while simultaneously studying their structure with the ESRF's extremely powerful X-ray beam. The results show that basalt produced on the ocean floor has a melting temperature lower than the peridotite which forms Earth's mantle. Near the core-mantle boundary, where the temperature rises rapidly, the melting basalt produces liquids rich in silica (SiO2), which react rapidly with the mantle and indicate a speedy dissolution of the basalt back into the depths of the Earth. These experiments provide a new explanation for seismic anomalies at the base of the mantle while fixing its temperature in the region of 4000 K. The results are published in Science on the 23 May 2014.

Earth is an active planet. The heat it contains is capable of inducing the mantle convection responsible for plate tectonics. This energy comes from the heat accumulated during the formation of our planet, the latent heat of crystallization of the inner core, and radioactive decay. The temperatures inside Earth, however, are not well known.

Convection causes hot material to rise to the surface of Earth and cold material to sink towards the core. Thus, when the ascending mantle begins to melt at the base of the oceanic ridges, the basalt flows along the surface to form what we call the oceanic crust. "Over the course of millennia the crust will then undergo subduction, its greater density causing it to sink into the mantle. This is why Earth's continents are known to be several billion years old, while the oldest oceanic crust only dates back 165 million years" said Mohamed Mezouar, scientist at the ESRF.

The temperature at the core-mantle boundary (also known as the D" region) is thought to increase by more than 1000 degrees over a few hundred kilometers, which is significant compared to the temperature gradient across the rest of the mantle. Previous authors have suggested that this temperature rise could cause the partial melting of the mantle, but this hypothesis leaves a number of geophysical observations unexplained. Firstly, the anomalies in the propagation speed of seismic waves do not match those expected for a partial melting of the mantle, and secondly, the melting mantle should lead to the production of liquid pockets in the lowermost mantle, a phenomenon which has never been observed.

The team led by Professor Denis Andrault from the Universitรฉ Blaise Pascal decided instead to study the melting point of basalt at high depths, and found that it was significantly lower than that of the mantle. The melting of sub-oceanic basalt piles could therefore be responsible for the previously unexplained seismic anomalies. The researchers also showed that the melting basalt generates a liquid rich in SiO2. As the mantle itself contains large quantities of MgO, the interaction of these liquids with the mantle is expected to produce a rapid reaction leading to the formation of the solid MgSiO3 perovskite. This would explain why no liquid pockets have been detected by seismologists in the deep mantle: any streams of liquid should rapidly re-solidify.

If it is indeed the basalt and not the mantle whose melting in the D"-region is responsible for the observed seismic anomalies, then the temperature at the core-mantle boundary must be between 3800 and 4150 Kelvin, between the melting points of basalt and Earth's mantle. If this hypothesis is correct, this would be the most accurate determination of the temperature at the core-mantle boundary available today.

"It could solve a long time controversy about the peculiar role of the core-mantle boundary in the dynamical properties of the Earth mantle, said Professor Denis Andrault. ''We know now that the cycle of crust formation at the mid-ocean ridges and crust dissolution in the lowermost mantle may have occured since plate tectonics were active on our planet'', he added.

Source: European Synchrotron Radiation Facility

Earthquakes: The next 'Big One' for the San Francisco Bay Area may be a cluster of major quakes

Acluster of closely timed earthquakes over 100 years in the 17th and 18th centuries released as much accumulated stress on San Francisco Bay Area's major faults as the Great 1906 San Francisco earthquake, suggesting two possible scenarios for the next "Big One" for the region, according to new research published by the Bulletin of the Seismological Society of America (BSSA).

"The plates are moving," said David Schwartz, a geologist with the U.S. Geological Survey and co-author of the study. "The stress is re-accumulating, and all of these faults have to catch up. How are they going to catch up?"

The San Francisco Bay Region (SFBR) is considered within the boundary between the Pacific and North American plates. Energy released during its earthquake cycle occurs along the region's principal faults: the San Andreas, San Gregorio, Calaveras, Hayward-Rodgers Creek, Greenville, and Concord-Green Valley faults.

"The 1906 quake happened when there were fewer people, and the area was much less developed," said Schwartz. "The earthquake had the beneficial effect of releasing the plate boundary stress and relaxing the crust, ushering in a period of low level earthquake activity."

The earthquake cycle reflects the accumulation of stress, its release as slip on a fault or a set of faults, and its re-accumulation and re-release. The San Francisco Bay Area has not experienced a full earthquake cycle since its been occupied by people who have reported earthquake activity, either through written records or instrumentation. Founded in 1776, the Mission Dolores and the Presidio in San Francisco kept records of felt earthquakes and earthquake damage, marking the starting point for the historic earthquake record for the region.

"We are looking back at the past to get a more reasonable view of what's going to happen decades down the road," said Schwartz. "The only way to get a long history is to do these paleoseismic studies, which can help construct the rupture histories of the faults and the region. We are trying to see what went on and understand the uncertainties for the Bay Area."

Schwartz and colleagues excavated trenches across faults, observing past surface ruptures from the most recent earthquakes on the major faults in the area. Radiocarbon dating of detrital charcoal and the presence of non-native pollen established the dates of paleoearthquakes, expanding the span of information of large events back to 1600.

The trenching studies suggest that between 1690 and the founding of the Mission Dolores and Presidio in 1776, a cluster of earthquakes ranging from magnitude 6.6 to 7.8 occurred on the Hayward fault (north and south segments), San Andreas fault (North Coast and San Juan Bautista segments), northern Calaveras fault, Rodgers Creek fault, and San Gregorio fault. There are no paleoearthquake data for the Greenville fault or northern extension of the Concord-Green Valley fault during this time interval.
"What the cluster of earthquakes did in our calculations was to release an amount of energy somewhat comparable to the amount released in the crust by the 1906 quake," said Schwartz.

As stress on the region accumulates, the authors see at least two modes of energy release -- one is a great earthquake and other is a cluster of large earthquakes. The probability for how the system will rupture is spread out over all faults in the region, making a cluster of large earthquakes more likely than a single great earthquake.

"Everybody is still thinking about a repeat of the 1906 quake," said Schwartz. "It's one thing to have a 1906-like earthquake where seismic activity is shut off, and we slide through the next 110 years in relative quiet. But what happens if every five years we get a magnitude 6.8 or 7.2? That's not outside the realm of possibility."

Source: Seismological Society of America

The California mountains rise as groundwater depleted in state's Central Valley: May trigger small earthquakes

GPS measurements show that the Sierra Nevada and Coast Ranges rise several millimeters per year (red dots) as a result of groundwater pumping in the Central Valley (brown). Blue dots are sites where the ground has subsided. Credit: Image courtesy of UC Berkeley
Winter rains and summer groundwater pumping in California's Central Valley make the Sierra Nevada and Coast Ranges sink and rise by a few millimeters each year, creating stress on the state's earthquake faults that could increase the risk of a quake.

Gradual depletion of the Central Valley aquifer because of groundwater pumping also raises these mountain ranges by a similar amount each year -- about the thickness of a dime -- with a cumulative rise over the past 150 years of up to 15 centimeters (6 inches), according to calculations by a team of geophysicists.

While the seasonal changes in the Central Valley aquifer have not yet been firmly associated with any earthquakes, studies have shown that similar levels of periodic stress, such as that caused by the motions of the moon and sun, increase the number of microquakes on the San Andreas Fault, which runs parallel to the mountain ranges. If these subtle seasonal load changes are capable of influencing the occurrence of microquakes, it is possible that they can sometimes also trigger a larger event, said Roland Bรผrgmann, UC Berkeley professor of earth and planetary science at UC Berkeley.

"The stress is very small, much less than you need to build up stress on a fault toward an earthquake, but in some circumstances such small stress changes can be the straw that broke the camel's back; it could just give that extra push to get a fault to fail," Bรผrgmann said.

Bรผrgmann is a coauthor of a report published online this week by the journal Nature. The study, based on detailed global positioning satellite (GPS) measurements from California and Nevada between 2007 and 2010, was led by former UC Berkeley postdoctoral fellows Colin Amos, now at Western Washington University, and Pascal Audet, now of the University of Ottawa. The detailed GPS analysis was performed by William C. Hammond and Geoffrey Blewitt of the University of Nevada, Reno.

Draining of Central Valley
Water has been pumped from California's Central Valley for more than 150 years, reducing what used to be a marsh and extensive lake, Tulare Lake, into fertile agricultural fields that feed the world. In that time, approximately 160 cubic kilometers (40 cubic miles) of water was removed -- the capacity of Lake Tahoe -- dropping the water table in some areas more than 120 meters (400 feet) and the ground surface 5 meters (16 feet) or more.

The weight of water removed allowed the underlying crust or lithosphere to rise by so-called isostatic rebound, which has raised the Sierra probably as much as half a foot since about 1860, Bรผrgmann said.
The same rebound happens as a result of the state's seasonal rains. Torrential winter storms drop water and snow across the state, which eventually flow into Central Valley streams, reservoirs and underground aquifer, pushing down the crust and lowering the Sierra 1-3 millimeters. In the summer, water flow through the delta into the Pacific Ocean, evaporation and ground water pumping for irrigation, which has accelerated in the past few years because of a drought, allows the crust and surrounding mountains to rise again.

Bรผrgmann said that the flexing of Earth's crust downward in winter would clamp the San Andreas Fault tighter, lowering the risk of quakes, while in summer the upward flexure would relieve this clamping and perhaps increase the risk.

"The hazard is ever so slightly higher in the summer than in the wintertime," he said. "This suggests that climate and tectonics interact; that water changes ultimately affect the deeper Earth too."

High-resolution mapping with continuous GPS
Millimeter-precision measurements of elevation have been possible only in the last few years, with improved continuous GPS networks -- part of the National Science Foundation-funded Plate Boundary Observatory, which operates 1,100 stations around the western U.S. -- and satellite-based interferometric synthetic aperture radar (InSAR). Synthetic aperture radar is a form of radar in which phase information is used to map elevation.

These measurements revealed a steady yearly rise of the Sierra of 1-2 millimeters per year, which was initially ascribed to tectonic activity deep underground, even though the rate was unusually high, Bรผrgmann said. The new study provides an alternative and more reasonable explanation for the rise of the Sierra in historic times.

"The Coast Range is doing the same thing as the Sierra Nevada, which is part of the evidence that this can't be explained by tectonics," he said. "Both ranges have uplifted over the last few years and they both exhibit the same seasonal up and down movement in phase. This tells us that something has to be driving the system at a seasonal and long-term sense, and that has to be groundwater recharging and depletion."

In response to the current drought, about 30 cubic kilometers (7.5 cubic miles) of water were removed from Central Valley aquifers between 2003 and 2010, causing a rise of about 10 millimeters (2/5 inch) in the Sierra over that time.

After the new results were shared with colleagues, Bรผrgmann said, some geologists suggested that the state could get a better or at least comparable inventory of available water each year by using GPS to measure ground deformation instead of measuring snowpack and reservoir levels.

Other coauthors are Colin B. Amos of Western Washington University in Bellingham, Ingrid A. Johanson of UC Berkeley. Funding for the research came from NSF EarthScope and UC Berkeley's Miller Institute.

Source: University of California - Berkeley

The New insight may help predict volcanic eruption behavior

Using friction experiments University of Liverpool scientists have shown that frictional melting plays a role in determining how a volcano will erupt. Credit: Dr. Jackie Kendrick
A new discovery in the study of how lava dome volcanoes erupt may help in the development of methods to predict how a volcanic eruption will behave, say scientists at the University of Liverpool.

Volcanologists at the University have discovered that a process called frictional melting plays a role in determining how a volcano will erupt, by dictating how fast magma can ascend to the surface, and how much resistance it faces en-route.

The process occurs in lava dome volcanoes when magma and rocks melt as they rub against each other due to intense heat. This creates a stop start movement in the magma as it makes its way towards Earth's surface. The magma sticks to the rock and stops moving until enough pressure builds up, prompting it to shift forward again (a process called stick-slip).

Volcanologist, Dr Jackie Kendrick, who lead the research said: "Seismologists have long known that frictional melting takes place when large tectonic earthquakes occur. It is also thought that the stick-slip process that frictional melting generates is concurrent to 'seismic drumbeats' which are the regular, rhythmic small earthquakes which have been recently found to accompany large volcanic eruptions.
"Using friction experiments we have shown that the extent of frictional melting depends on the composition of the rock and magma, which determines how fast or slow the magma travels to the surface during the eruption."

Analysis of lava collected from Mount St. Helens, USA and the Soufriรจre Hills volcano in Montserrat by volcanology researchers from the University's School of Environmental Sciences revealed remnants of pseudotachylyte, a cooled frictional melt. Evidence showed that the process took place in the conduit, the channel which lava passes through on its way to erupt.

Dr Kendrick, from the University's School of Environmental Sciences, added: "The closer we get to understanding the way magma behaves, the closer we will get to the ultimate goal: predicting volcanic activity when unrest begins. Whilst we can reasonably predict when a volcanic eruption is about to happen, this new knowledge will help us to predict how the eruption will behave.

"With a rapidly growing population inhabiting the flanks of active volcanoes, understanding the behaviour of lava domes becomes an increasing challenge for volcanologists."

Source: University of Liverpool

The Magnitude of maximum earthquake scales with maturity of fault

The oldest sections of transform faults, such as the North Anatolian Fault Zone (NAFZ) and the San Andreas Fault, produce the largest earthquakes, putting important limits on the potential seismic hazard for less mature parts of fault zones, according to a new study to be presented today at the Seismological Society of America (SSA) 2014 Annual Meeting in Anchorage, Alaska. The finding suggests that maximum earthquake magnitude scales with the maturity of the fault.

Identifying the likely maximum magnitude for the NAFZ is critical for seismic hazard assessments, particularly given its proximity to Istanbul.

"It has been argued for decades that fault systems evolving over geological time may unify smaller fault segments, forming mature rupture zones with a potential for larger earthquake," said Marco Bohnhoff, professor of geophysics at the German Research Center for Geosciences in Potsdam, Germany, who sought to clarify the seismic hazard potential from the NAFZ. "With the outcome of this study it would in principal be possible to improve the seismic hazard estimates for any transform fault near a population center, once its maturity can be quantified," said Bohnhoff.

Bohnhoff and colleagues investigated the maximum magnitude of historic earthquakes along the NAFZ, which poses significant seismic hazard to northwest Turkey and, specifically, Istanbul.
Relying on the region's extensive literary sources that date back more than 2000 years, Bohnhoff and colleagues used catalogues of historical earthquakes in the region, analyzing the earthquake magnitude in relation to the fault-zone age and cumulative offset across the fault, including recent findings on fault-zone segmentation along the NAFZ.

"What we know of the fault zone is that it originated approximately 12 million years ago in the east and migrated to the west," said Bohnhoff. "In the eastern portion of the fault zone, individual fault segments are longer and the offsets are larger."

The largest earthquakes of approximately M 8.0 are exclusively observed along the older eastern section of the fault zone, says Bohnhoff. The younger western sections, in contrast, have historically produced earthquakes of magnitude no larger than 7.4.

"While a 7.4 earthquake is significant, this study puts a limit on the current seismic hazard to northwest Turkey and its largest regional population and economical center Istanbul," said Bohnhoff.

Bohnhoff compared the study of the NAFZ to the San Andreas and the Dead Sea Transform Fault systems. While the earlier is well studied instrumentally with few historic records, the latter has an extensive record of historical earthquakes but few available modern fault-zone investigations. Both of these major transform fault systems support the findings for the NAFZ that were derived based on a unique combination of long historical earthquake records and in-depth fault-zone studies.

Bohnhoff will present his study, "Fault-Zone Maturity Defines Maximum Earthquake Magnitude," today at the SSA Annual Meeting. SSA is an international scientific society devoted to the advancement of seismology and the understanding of earthquakes for the benefit of society. Its 2014 Annual Meeting will be held Anchorage, Alaska on April 30 -- May 2, 2014

Source: Seismological Society of America

The thin-crusted U.S. Sierra Nevada Mountains: Where did the Earth go?

Geologic map showing seismic stations used in the study by C.H. Jones and colleagues, "P-wave tomography of potential convective down-wellings and their source regions, Sierra Nevada, California."
Credit: Image courtesy of Geological Society of America
In an addition to Geosphere's ongoing themed issue series, "Geodynamics and Consequences of Lithospheric Removal in the Sierra Nevada, California," Craig H. Jones of the University of Colorado Boulder and colleagues examine the seismological study of the entire extent of the U.S. Sierra Nevada range using seismograms collected in the Sierra Nevada EarthScope field experiment from 2005 to 2007.

The southern Sierra Nevada is known to have unusually thin crust for mountains with such high elevations (peaks higher than 4 km/14,000 ft, and average elevations near 3 km/10,000 ft). Jones and his team use measurements of the arrival times of seismic waves (called P-waves) from earthquakes around the globe to image Earth under the Sierra Nevada and neighboring locations.

Their results reveal that the entire eastern Sierra overlies low-velocity upper mantle and lacks the dense, quartz-poor lower crust that they say must have existed 80 million years ago when the granites of the range were created.

Jones and colleagues write that this missing dense material probably was removed within the past 10 million years. "Previous workers," they note, "have suggested it might be within a high-velocity mantle anomaly under the southeastern San Joaquin Valley," which is "the right size to be the old, dense rock previously under the eastern Sierra."

They argue, however, that the geometry and extent of earth within the anomaly does not appear to be consistent with it being a piece of old subducted ocean floor. This would mean that a long strip of dense rock under the Sierra somehow deformed into a steeply plunging ellipsoid at the southwestern edge of the range. This conclusion suggests that the range rose within the past 10 million years as this dense material fell away to the west and south. Finally, Jones and colleagues note that something similar might be underway at the northern edge of the range.

Source: Geological Society of America

The Ant colonies help evacuees in disaster zones

Trail of ants (stock image). Credit: © grekoff / Fotolia
An escape route mapping system based on the behavior of ant colonies could give evacuees a better chance of reaching safe harbor after a natural disaster or terrorist attack by building a map showing the shortest routes to shelters and providing regular updates of current situations such as fires, blocked roads or other damage via the smart phones of emergency workers and those caught up in the disaster.

Koichi Asakura of Daido University in Nagoya and Toyohide Watanabe of the Nagoya Industrial Science Research Institute in Japan have carried out successful simulations of the construction of navigational maps using this approach and report details in the International Journal of Knowledge and Web Intelligence. Following a major earthquake, tsunami, typhoon or other disaster it is crucial for those affected, including emergency workers, to obtain and share accurate and timely information about the situation as it unfolds. Lives can only be saved if evacuation to safe areas and shelters is not stymied by blocked roads, fires and other problems.

The team's new system has two key features: First it utilizes the smart phones that are now ubiquitous across cities as networked, mobile sensors that can feed information back to emergency centers. The second feature exploits our understanding of the behavior of an ant colony. This provides a way to determine whether or not particular problems are recent or not, just as individual ants use pheromone trails, and the concentration changes in those pheromones to assess how recently a colony member left a particular signal and so find the optimal routes to and from the nest via food supplies. By using this approach to analyze the data from myriad smart phones as evacuees head for shelter, it is possible to build an active navigational map using the phones' GPS and other tools.

The system circumvents the problem that would be almost inevitable during a disaster that closed circuit television (CCTV) cameras would be unreliable whereas sufficient numbers of wireless communication devices might remain active for sufficient time given a large enough number of service providers and communication towers spread widely across the disaster area. The next step will be to develop an ad hoc mobile networking system so that evacuees can themselves access these active maps rather than the present system that provides advice to emergency services for guiding evacuees. Such a network might also circumvent the problem of service provider outages by allowing individual smart phones to create a local network.

Source: Inderscience Publishers

The Earthquake simulation tops one petaflop mark

Visualization of vibrations inside the Merapi volcano. Credit: Alex Breuer/Christian Pelties
A team of computer scientists, mathematicians and geophysicists at Technische Universitaet Muenchen (TUM) and Ludwig-Maximillians Universitaet Muenchen (LMU) have -- with the support of the Leibniz Supercomputing Center of the Bavarian Academy of Sciences and Humanities (LRZ) -- optimized the SeisSol earthquake simulation software on the SuperMUC high performance computer at the LRZ to push its performance beyond the "magical" one petaflop/s mark -- one quadrillion floating point operations per second.

Geophysicists use the SeisSol earthquake simulation software to investigate rupture processes and seismic waves beneath Earth's surface. Their goal is to simulate earthquakes as accurately as possible to be better prepared for future events and to better understand the fundamental underlying mechanisms. However, the calculations involved in this kind of simulation are so complex that they push even super computers to their limits.

In a collaborative effort, the workgroups led by Dr. Christian Pelties at the Department of Geo and Environmental Sciences at LMU and Professor Michael Bader at the Department of Informatics at TUM have optimized the SeisSol program for the parallel architecture of the Garching supercomputer "SuperMUC," thereby speeding up calculations by a factor of five.

Using a virtual experiment they achieved a new record on the SuperMUC: To simulate the vibrations inside the geometrically complex Merapi volcano on the island of Java, the supercomputer executed 1.09 quadrillion floating point operations per second. SeisSol maintained this unusually high performance level throughout the entire three hour simulation run using all of SuperMUC's 147,456 processor cores.

Complete parallelization
This was possible only following the extensive optimization and the complete parallelization of the 70,000 lines of SeisSol code, allowing a peak performance of up to 1.42 petaflops. This corresponds to 44.5 percent of Super MUC's theoretically available capacity, making SeisSol one of the most efficient simulation programs of its kind worldwide.

"Thanks to the extreme performance now achievable, we can run five times as many models or models that are five times as large to achieve significantly more accurate results. Our simulations are thus inching ever closer to reality," says the geophysicist Dr. Christian Pelties. "This will allow us to better understand many fundamental mechanisms of earthquakes and hopefully be better prepared for future events."

The next steps are earthquake simulations that include rupture processes on the meter scale as well as the resultant destructive seismic waves that propagate across hundreds of kilometers. The results will improve the understanding of earthquakes and allow a better assessment of potential future events.
"Speeding up the simulation software by a factor of five is not only an important step for geophysical research," says Professor Michael Bader of the Department of Informatics at TUM. "We are, at the same time, preparing the applied methodologies and software packages for the next generation of supercomputers that will routinely host the respective simulations for diverse geoscience applications."
Besides Michael Bader and Christian Pelties also Alexander Breuer, Dr. Alexander Heinecke and Sebastian Rettenberger (TUM) as well as Dr. Alice Agnes Gabriel and Stefan Wenk (LMU) worked on the project. In June the results will be presented at the International Supercomputing Conference in Leipzig (ISC'14, Leipzig, 22-June 26, 2014; title: Sustained Petascale Performance of Seismic Simulation with SeisSol on SuperMUC)

Source: Technische Universitaet Muenchen

The Tibetan Plateau was larger than previously thought, geologists say

Known as the "Roof of the World," the Tibetan Plateau covers more than 970,000 square miles in Asia and India and reaches heights of over 15,000 feet. Hoke's discovery not only makes the plateau larger than previously thought, but also suggests that some of the topography is millions of years younger. Credit: Image courtesy of Syracuse University
Earth scientists in Syracuse University's College of Arts and Sciences have determined that the Tibetan Plateau -- the world's largest, highest, and flattest plateau -- had a larger initial extent than previously documented.

Their discovery is the subject of an article in the journal Earth and Planetary Science Letters (Elsevier, 2014).

Gregory Hoke, assistant professor of Earth sciences, and Gregory Wissink, a Ph.D. student in his lab, have co-authored the article with Jing Liu-Zeng, director of the Division of Neotectonics and Geomorphology at the Institute for Geology, part of the China Earthquake Administration; Michael Hren, assistant professor of chemistry at the University of Connecticut; and Carmala Garzione, professor and chair of Earth and environmental sciences at the University of Rochester.

"We've determined the elevation history of the southeast margin of the Tibetan Plateau," says Hoke, who specializes in the interplay between Earth's tectonic and surface processes. "By the Eocene epoch (approximately 40 million years ago), the southern part of the plateau extended some 600 miles more to the east than previously documented. This discovery upends a popular model for plateau formation."
Known as the "Roof of the World," the Tibetan Plateau covers more than 970,000 square miles in Asia and India and reaches heights of over 15,000 feet. The plateau also contains a host of natural resources, including large mineral deposits and tens of thousands of glaciers, and is the headwaters of many major drainage basins.

Hoke says he was attracted to the topography of the plateau's southeast margin because it presented an opportunity to use information from minerals formed at Earth's surface to infer what happened below them in the crust.

"The tectonic and topographic evolution of the southeast margin has been the subject of considerable controversy," he says. "Our study provides the first quantitative estimate of the past elevation of the eastern portions of the plateau."

Historically, geologists have thought that lower crustal flow -- a process by which hot, ductile rock material flows from high- to low-pressure zones -- helped elevate parts of the plateau about 20 million years ago. (This uplift model has also been used to explain watershed reorganization among some of the world's largest rivers, including the Yangtze in China.)

But years of studying rock and water samples from the plateau have led Hoke to rethink the area's history. For starters, his data indicates that the plateau has been at or near its present elevation since the Eocene epoch. Moreover, surface uplift in the southernmost part of the plateau -- in and around southern China and northern Vietnam -- has been historically small.

"Surface uplift, caused by lower crustal flow, doesn't explain the evolution of regional river networks," says Hoke, referring to the process by which a river drainage system is diverted, or captured, from its own bed into that of a neighboring bed. "Our study suggests that river capture and drainage reorganization must have been the result of a slip on the major faults bounding the southeast plateau margin."

Hoke's discovery not only makes the plateau larger than previously thought, but also suggests that some of the topography is millions of years younger.

"Our data provides the first direct documentation of the magnitude and geographic extent of elevation change on the southeast margin of the Tibetan Plateau, tens of millions years ago," Hoke adds. "Constraining the age, spatial extent, and magnitude of ancient topography has a profound effect on how we understand the construction of mountain ranges and high plateaus, such as those in Tibet and the Altiplano region in Bolivia."

Source: Syracuse University

The Scientists reconstruct ancient impact that dwarfs dinosaur-extinction blast

A graphical representation of the size of the asteroid thought to have killed the dinosaurs, and the crater it created, compared to an asteroid thought to have hit the Earth 3.26 billion years ago and the size of the crater it may have generated. A new study reveals the power and scale of the event some 3.26 billion years ago which scientists think created geological features found in a South African region known as the Barberton greenstone belt.
Credit: Image courtesy of American Geophysical Union
Picture this: A massive asteroid almost as wide as Rhode Island and about three to five times larger than the rock thought to have wiped out the dinosaurs slams into Earth. The collision punches a crater into the planet's crust that's nearly 500 kilometers (about 300 miles) across: greater than the distance from Washington, D.C. to New York City, and up to two and a half times larger in diameter than the hole formed by the dinosaur-killing asteroid. Seismic waves bigger than any recorded earthquakes shake the planet for about half an hour at any one location -- about six times longer than the huge earthquake that struck Japan three years ago. The impact also sets off tsunamis many times deeper than the one that followed the Japanese quake.

Although scientists had previously hypothesized enormous ancient impacts, much greater than the one that may have eliminated the dinosaurs 65 million years ago, now a new study reveals the power and scale of a cataclysmic event some 3.26 billion years ago which is thought to have created geological features found in a South African region known as the Barberton greenstone belt. The research has been accepted for publication in Geochemistry, Geophysics, Geosystems, a journal of the American Geophysical Union.

The huge impactor -- between 37 and 58 kilometers (23 to 36 miles) wide -- collided with the planet at 20 kilometers per second (12 miles per second). The jolt, bigger than a 10.8 magnitude earthquake, propelled seismic waves hundreds of kilometers through Earth, breaking rocks and setting off other large earthquakes. Tsunamis thousands of meters deep -- far bigger than recent tsunamis generated by earthquakes -- swept across the oceans that covered most of Earth at that time.

"We knew it was big, but we didn't know how big," Donald Lowe, a geologist at Stanford University and a co-author of the study, said of the asteroid.

Lowe, who discovered telltale rock formations in the Barberton greenstone a decade ago, thought their structure smacked of an asteroid impact. The new research models for the first time how big the asteroid was and the effect it had on the planet, including the possible initiation of a more modern plate tectonic system that is seen in the region, according to Lowe.

The study marks the first time scientists have mapped in this way an impact that occurred more than 3 billion years ago, Lowe added, and is likely one of the first times anyone has modeled any impact that occurred during this period of Earth's evolution.

The impact would have been catastrophic to the surface environment. The smaller, dino-killing asteroid crash is estimated to have released more than a billion times more energy than the bombs that destroyed Hiroshima and Nagasaki. The more ancient hit now coming to light would have released much more energy, experts said.

The sky would have become red hot, the atmosphere would have been filled with dust and the tops of oceans would have boiled, the researchers said. The impact sent vaporized rock into the atmosphere, which encircled the globe and condensed into liquid droplets before solidifying and falling to the surface, according to the researchers.

The impact may have been one of dozens of huge asteroids that scientists think hit Earth during the tail end of the Late Heavy Bombardment period, a major period of impacts that occurred early in Earth's history -- around 3 billion to 4 billion years ago.

Many of the sites where these asteroids landed were destroyed by erosion, movement Earth's crust and other forces as Earth evolved, but geologists have found a handful of areas in South Africa, and Western Australia that still harbor evidence of these impacts that occurred between 3.23 billion and 3.47 billion years ago. The study's co-authors think the asteroid hit Earth thousands of kilometers away from the Barberton Greenstone Belt, although they can't pinpoint the exact location.

"We can't go to the impact sites. In order to better understand how big it was and its effect we need studies like this," said Lowe. Scientists must use the geological evidence of these impacts to piece together what happened to the Earth during this time, he said.

The study's findings have important implications for understanding the early Earth and how the planet formed. The impact may have disrupted Earth's crust and the tectonic regime that characterized the early planet, leading to the start of a more modern plate tectonic system, according to the paper's co-authors.
The pummeling the planet endured was "much larger than any ordinary earthquake," said Norman Sleep, a physicist at Stanford University and co-author of the study. He used physics, models, and knowledge about the formations in the Barberton greenstone belt, other earthquakes and other asteroid impact sites on Earth and the moon to calculate the strength and duration of the shaking that the asteroid produced. Using this information, Sleep recreated how waves traveled from the impact site to the Barberton greenstone belt and caused the geological formations.

The geological evidence found in the Barberton that the paper investigates indicates that the asteroid was "far larger than anything in the last billion years," said Jay Melosh, a professor at Purdue University in West Lafayette, Indiana, who was not involved in the research.

The Barberton greenstone belt is an area 100 kilometers (62 miles) long and 60 kilometers (37 miles) wide that sits east of Johannesburg near the border with Swaziland. It contains some of the oldest rocks on the planet.

The model provides evidence for the rock formations and crustal fractures that scientists have discovered in the Barberton greenstone belt, said Frank Kyte, a geologist at UCLA who was not involved in the study.

"This is providing significant support for the idea that the impact may have been responsible for this major shift in tectonics," he said.

Reconstructing the asteroid's impact could also help scientists better understand the conditions under which early life on the planet evolved, the paper's authors said. Along with altering Earth itself, the environmental changes triggered by the impact may have wiped out many microscopic organisms living on the developing planet, allowing other organisms to evolve, they said.

"We are trying to understand the forces that shaped our planet early in its evolution and the environments in which life evolved," Lowe said.

Source: American Geophysical Union

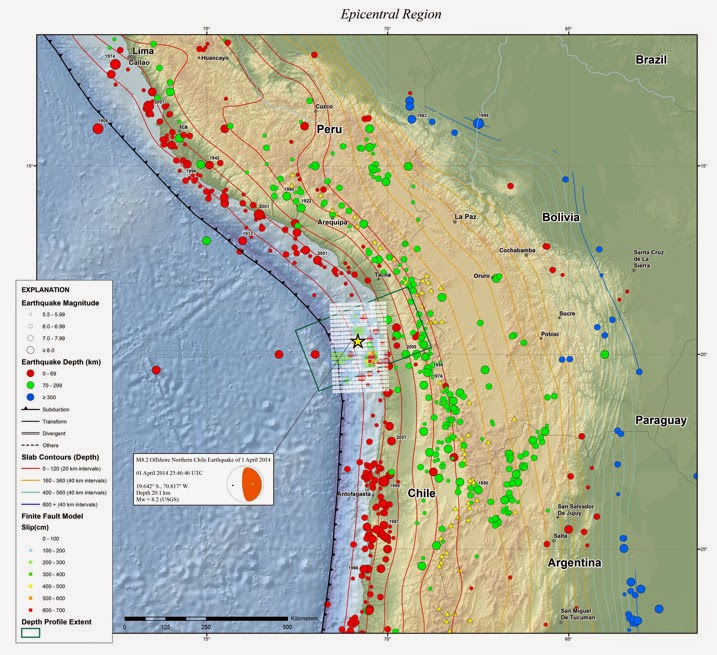
More Earthquakes for Chile? Seismic gap has not been closed

GPS measurements of the displacement vectors. Credit: GFZ
After the strong earthquake that struck Chile on April 2 (CEST), numerous aftershocks, some of them of a considerable magnitude, have struck the region around Iquique. Seismologists from the GFZ German Research Centre for Geosciences doubt that the strong earthquake closed the local seismic gap and decreased the risk of a large earthquake. On the contrary, initial studies of the rupture process and the aftershocks show that only about a third of the vulnerable zone broke.

This vulnerable area is referred to as the seismic gap of Iquique and a strong earthquake is expected to strike here. The Pacific Nazca plate meets the South American plate at South America's west coast. "In a subsea trench along the coast, the Pacific Ocean floor submerges beneath the continent building up tension that is released in earthquakes," explains Professor Onno Oncken of the GFZ. "In the course of about 150 years the entire plate boundary from Patagonia in the South to Panama in the North breaks completely with a segmented series of strong earthquakes." This cycle has been completed except for a last segment west of Iquique in northern Chile. As expected, the strong earthquake of April 2 took place exactly at this seismic gap.

No All-Clear
Initial analyses conducted by GFZ seismologists have shown that there is no sign that tension in the earth' crust has significantly decreased: "So far tension has been released only in the central section of this vulnerable zone," Oncken further explains. The series of earthquakes began on March 16 with a 6.7-magnitude earthquake. Although the main earthquake with a magnitude of 8.1 broke the central section of the seismic gap of a length of some 100 kilometres, two large segments further north and south remain intact, and these segments are able to cause strong earthquakes with a high risk of ground shaking and tsunamis.Oncken: "This means that the risk of one or even several earthquakes with a magnitude clearly above 8 still exists." Furthermore, the location and magnitude of the aftershocks suggest such a scenario.

Since the main quake struck, hundreds of aftershocks have been registered, the strongest that of April 2 (CEST) of a magnitude of 7.6. This earthquake struck about 100 kilometres south of the main earthquake's epicentre. Together with the its associated aftershocks, it forms a second rupture zone.

Scientists getting ready for a field trip
For such extreme events, the GFZ has a task force called HART (Hazard and Risk Team) that will travel to the area affected to conduct further studies. The assignment aims at gaining a better and more detailed understanding of the rupture process based on the aftershocks, and defining the rupture surface more precisely based on the distribution of the aftershocks. Currently 25 seismometers are being prepared for air transport. Early next week a team of eight GFZ scientists will fly to Chile. The 25 portable seismometers will be used to expand the existing observatory network IPOC (Integrated Plate Boundary Observatory Chile) in order to be able to determine the earthquake epicentres more precisely. In addition highly precise surface displacements will be measured at 50 GPS measuring points. Two new additional continuous GPS stations will be installed to determine how the earthquake has deformed the earth' crust.

The Helmholtz Centre for Ocean Research Geomar in Kiel intends to support the measuring campaign. Ocean floor seismometers will supplement land-based seismic data by providing measurements of the aftershocks on the seafloor.

The Plate Boundary Observatory IPOC in Chile
The GFZ initiated the setup of an observatory directly within the seismic gap in northern Chile in order to be able to precisely measure and capture tectonic processes before, during and after the expected strong earthquake. The observatory called Integrated Plate Boundary Observatory Chile (IPOC) is a European-American network of institutions and scientists. Together with several Chilean and German universities, German, French, Chilean and American non-university research institutions operate a decentralized instrumentation system located at Chile's convergent plate boundary to gather data on earthquakes, deformations, magmatism, and surface processes.

The mission succeeded in the case of the April 2 earthquake: "All our instruments survived the quake and aftershocks unscathed. We now have a set of data that is unique in the world," says GFZ seismologist Gรผnter Asch with a smile, who was responsible for checking the instruments on site right after the earthquake and who is once again on his way to the region. "We believe that these data will help us understand the entire earthquake process -- from the phase that tension builds up to the actual rupture, and also during the post-seismic phase." This understanding will provide insights into earthquake risks in this part of the world as well as elsewhere.

The IPOC will further expand. To this day more than 20 multi-parameter stations have been set up. They comprise broadband seismographs, accelerometers, continuous GPS receivers, magneto-telluric probes, expansion measuring devices and climate sensors. Their data is transferred to Potsdam in real time. The European Southern Observatory on Cerro Paranal is now also part of the observatory network

Source: Helmholtz Centre Potsdam - GFZ German Research Centre for Geosciences

The Hot mantle drives elevation, volcanism along mid-ocean ridges

Temperature, not chemistry. What appears on the surface correlates with temperature deep in the Earth. Higher ridge elevation indicates a hotter mantle -- as in Iceland, above, which also appears to sit atop a mantle plume, a vertical jet of hot rock originating from deep in the Earth. Credit: Allison Gale/University of Wisconsin
Scientists have shown that temperature differences deep within Earth's mantle control the elevation and volcanic activity along mid-ocean ridges, the colossal mountain ranges that line the ocean floor. The findings, published April 4 in the journal Science, shed new light on how temperature in the depths of the mantle influences the contours of Earth's crust.

Mid-ocean ridges form at the boundaries between tectonic plates, circling the globe like seams on a baseball. As the plates move apart, magma from deep within Earth rises up to fill the void, creating fresh crust as it cools. The crust formed at these seams is thicker in some places than others, resulting in ridges with widely varying elevations. In some places, the peaks are submerged miles below the ocean surface. In other places -- Iceland, for example -- the ridge tops are exposed above the water's surface.
"These variations in ridge depth require an explanation," said Colleen Dalton, assistant professor of geological sciences at Brown and lead author of the new research. "Something is keeping them either sitting high or sitting low."

That something, the study found, is the temperature of rocks deep below Earth's surface.
By analyzing the speeds of seismic waves generated by earthquakes, the researchers show that mantle temperature along the ridges at depths extending below 400 kilometers varies by as much as 250 degrees Celsius. High points on the ridges tend to be associated with higher mantle temperatures, while low points are associated with a cooler mantle. The study also showed that volcanic hot spots along the ridge -- volcanoes near Iceland as well as the islands of Ascension, Tristan da Cunha, and elsewhere -- all sit above warm spots in Earth's mantle.

"It is clear from our results that what's being erupted at the ridges is controlled by temperature deep in the mantle," Dalton said. "It resolves a long-standing controversy and has not been shown definitively before."

A CAT scan of Earth
The mid-ocean ridges provide geologists with a window to the interior of Earth. The ridges form when mantle material melts, rises into the cracks between tectonic plates, and solidifies again. The characteristics of the ridges provide clues about the properties of the mantle below.

For example, a higher ridge elevation suggests a thicker crust, which in turn suggests that a larger volume of magma was erupted at the surface. This excess molten rock can be caused by very hot temperatures in the mantle. The problem is that hot mantle is not the only way to produce excess magma. The chemical composition of the rocks in Earth's mantle also controls how much melt is produced. For certain rock compositions, it is possible to generate large volumes of molten rock under cooler conditions. For many decades it has not been clear whether mid-ocean ridge elevations are caused by variations in the temperature of the mantle or variations in the rock composition of the mantle.

To distinguish between these two possibilities, Dalton and her colleagues introduced two additional data sets. One was the chemistry of basalts, the rock that forms from solidification of magma at the mid-ocean ridge. The chemical composition of basalts differs depending upon the temperature and composition of the mantle material from which they're derived. The authors analyzed the chemistry of nearly 17,000 basalts formed along mid-ocean ridges around the globe.

The other data set was seismic wave tomography. During earthquakes, seismic waves are sent pulsing through the rocks in the crust and mantle. By measuring the velocity of those waves, scientists can gather data about the characteristics of the rocks through which they traveled. "It's like performing a CAT scan of the inside of the Earth," Dalton said.

Seismic wave speeds are especially sensitive to the temperature of rocks. In general, waves propagate more quickly in cooler rocks and more slowly in hotter rocks.

Dalton and her colleagues combined the seismic data from hundreds of earthquakes with data on elevation and rock chemistry from the ridges. Correlations among the three data sets revealed that temperature deep in the mantle varied between around 1,300 and 1,550 degrees Celsius underneath about 61,000 kilometers of ridge terrain. "It turned out," said Dalton, "that seismic tomography was the smoking gun. The only plausible explanation for the seismic wave speeds is a very large temperature range."

The study showed that as ridge elevation falls, so does mantle temperature. The coolest point beneath the ridges was found near the lowest point, an area of very deep and rugged seafloor known as the Australian-Antarctic discordance in the Indian Ocean. The hottest spot was near Iceland, which is also the ridges' highest elevation point.

Iceland is also where scientists have long debated whether a mantle plume -- a vertical jet of hot rock originating from deep inside Earth -- intersects the mid-ocean ridge. This study provides strong support for a mantle plume located beneath Iceland. In fact, this study showed that all regions with above-average temperature are located near volcanic hot spots, which points to mantle plumes as the culprit for the excess volume of magma in these areas.

Understanding a churning planet
Despite being made of solid rock, Earth's mantle doesn't sit still. It undergoes convection, a slow churning of material from the depths of the Earth toward the surface and back again.
"Convection is why we have plate tectonics and earthquakes," Dalton said. "It's also responsible for almost all volcanism at the surface. So understanding mantle convection is crucial to understanding many fundamental questions about the Earth."

Two factors influence how that convection works: variations in the composition of the mantle and variations in its temperature. This work, says Dalton, points to temperature as a primary factor in how convection is expressed on the surface.

"We get consistent and coherent temperature measurements from the mantle from three independent datasets," Dalton said. "All of them suggest that what we see at the surface is due to temperature, and that composition is only a secondary factor. What is surprising is that the data require the temperature variations to exist not only near the surface but also many hundreds of kilometers deep inside the Earth."

The findings from this study will also be useful in future research using seismic waves, Dalton says. Because the temperature readings as indicated by seismology were backed up by the other datasets, they can be used to calibrate seismic readings for places where geochemical samples aren't available. This makes it possible to estimate temperature deep in Earth's mantle all over the globe.

That will help geologists gain a new insights into how processes deep within Earth mold the ground beneath our feet.

Source: Brown University

The NASA model provides a 3-D look at L.A.-area quake

JPL scientists modeled the March 28, 2014 magnitude 5.1 quake near Los Angeles based on USGS seismic data. This model image shows how the quake may appear to airborne radar, such as NASA's UAVSAR, which will survey the area soon. Blue shades indicate the greatest surface displacement. Credit: NASA/JPL-Caltech/USGS/Google Earth
On March 28, residents of Greater Los Angeles experienced the largest earthquake to strike the region since 2008. The magnitude 5.1 quake was centered near La Habra in northwestern Orange County about 21 miles (33 kilometers) east-southeast of Los Angeles, and was widely felt throughout Southern California. There have been hundreds of aftershocks, including one of magnitude 4.1.

Scientists at NASA's Jet Propulsion Laboratory, Pasadena, Calif., have developed a model of the earthquake, based on the distribution of aftershocks and other seismic information from the U.S. Geological Survey.

A new image based on the model shows what the earthquake may look like through the eyes of an interferometric synthetic aperture radar, such as NASA's Uninhabited Aerial Vehicle Synthetic Aperture Radar (UAVSAR). JPL scientists plan to acquire UAVSAR data from the region of the March 28 quake, possibly as soon as this week, and process the data to validate and improve the results of their model.

The model image is online at: http://www.jpl.nasa.gov/spaceimages/details.php?id=pia18041
The earthquake is believed to be associated with the Puente Hills Thrust fault, a blind thrust fault (meaning it does not break the earth surface) that zigzags from Orange County northwest through downtown Los Angeles. The same fault was responsible for the magnitude 5.9 Whittier Narrows earthquake on Oct. 1, 1987, which caused eight fatalities, injured several hundred and left about $360 million in property damage.

The NASA model is based on a fault estimated to be 5.6 miles (9 kilometers) long, 3.1 miles (5 kilometers) deep and 1.9 miles (3 kilometers) wide. The modeled fault segment dips upward through the ground at a 60-degree angle. The model estimated that in this earthquake, one side of the fault moved at a slanted angle horizontally and vertically 3.9 inches (10 centimeters) relative to the other side. The model also estimated the maximum displacement of Earth's surface from the quake at approximately 0.4 inch (1 centimeter), which is at the threshold of what is detectable with UAVSAR. The region of greatest ground displacement is indicated by the darker blue area located in the right center of the image.

In Nov. 2008, NASA JPL scientists began conducting a series of UAVSAR flights over regions of Northern and Southern California that are actively deforming and are marked by frequent earthquakes. About every six months, the scientists precisely repeat the same flight paths to produce images of ground deformation called interferograms. From these data, 3-D maps are being created for regions of interest, including the San Andreas and other California faults, extending from the Gulf of California in Mexico to Santa Rosa in the northern San Francisco Bay.

UAVSAR, which flies on a NASA C-20A aircraft from NASA's Armstrong Flight Research Center in California, measures ground deformation over large areas to a precision of 0.04 to 0.2 inches (0.1 to 0.5 centimeters).

By comparing the repeat-pass radar observations, scientists hope to measure any crustal deformations that may occur between observations, allowing them to "see" the amount of strain building up on fault lines, and giving them a clearer picture of which faults are active and at what rates they're moving, both before earthquakes and after them. The UAVSAR fault mapping project is designed to substantially improve knowledge of regional earthquake hazards in California. The 3-D UAVSAR data will allow scientists to bring entire faults into focus, allowing them to understand faults not just at their surfaces, but also at depth. When integrated into computer models, the data should give scientists a much clearer picture of California's complex fault systems.

The scientists are estimating the total displacement occurring in each region. As additional observations are collected, they expect to be able to determine how strain is partitioned between individual faults.
The UAVSAR flights serve as a baseline for pre-earthquake activity. As earthquakes occur during the course of this project, the team is measuring the deformation at the time of the earthquakes to determine the distribution of slip on the faults, and then monitoring longer-term motions after the earthquakes to learn more about fault zone properties.

Airborne UAVSAR mapping can allow a rapid response after an earthquake to determine what fault was the source and which parts of the fault slipped during the earthquake. Information about the earthquake source can be used to estimate what areas were most affected by an earthquake's shaking to guide rescue efforts and damage assessment.

The model was developed as part of NASA's QuakeSim project. The JPL-developed QuakeSim is a comprehensive, state-of-the-art software tool for simulating and understanding earthquake fault processes and improving earthquake forecasting. Initiated in 2002, QuakeSim uses NASA remote sensing and other earthquake-related data to simulate and model the behavior of faults in 3-D both individually and as part of complex, interacting systems. This provides long-term histories of fault behavior that can be used for statistical evaluation. QuakeSim also is used to identify regions of increased earthquake probabilities, called hotspots.

NASA's Earthquake Data Enhanced Cyber-Infrastructure for Disaster Evaluation and Response (E-DECIDER) project, which provides tools for earthquake disaster management and response using remote sensing data and NASA earthquake modeling software, published the model results, along with automatically generated deformation models and aftershock forecasts on a La Habra earthquake event page: http://e-decider.org/content/la-habra-earthquake-march-2014

For more information about UAVSAR, visit: http://uavsar.jpl.nasa.gov/

Source: NASA/Jet Propulsion Laboratory

The Magnitude 8.2 earthquake off Chile: Thrust faulting at shallow depths near the Chilean coast

The April 1, 2014 M8.2 earthquake in northern Chile occurred as the result of thrust faulting at shallow depths near the Chilean coast. The location . Credit: Image courtesy of U.S. Geological Survey

Amagnitude 8.2 earthquake struck off Chile on April 1, 2014 at 23:46:46 UTC, according to the U.S. Geological Survey.

The following is information from the USGS event page on this earthquake.

Tectonic Summary
The April 1, 2014 M8.2 earthquake in northern Chile occurred as the result of thrust faulting at shallow depths near the Chilean coast. The location and mechanism of the earthquake are consistent with slip on the primary plate boundary interface, or megathrust, between the Nazca and South America plates. At the latitude of the earthquake, the Nazca plate subducts eastward beneath the South America plate at a rate of 65 mm/yr. Subduction along the Peru-Chile Trench to the west of Chile has led to uplift of the Andes mountain range and has produced some of the largest earthquakes in the world, including the 2010 M 8.8 Maule earthquake in central Chile, and the largest earthquake on record, the 1960 M 9.5 earthquake in southern Chile.

The April 1 earthquake occurred in a region of historic seismic quiescence -- termed the northern Chile or Iquique seismic gap. Historical records indicate a M 8.8 earthquake occurred within the Iquique gap in 1877, which was preceded immediately to the north by an M 8.8 earthquake in 1868.

A recent increase in seismicity rates has occurred in the vicinity of the April 1 earthquake. An M6.7 earthquake with similar faulting mechanism occurred on March 16, 2014 and was followed by 60+ earthquake of M4+, and 26 earthquakes of M5+. The March 16 earthquake was also followed by three M6.2 events on March 17, March 22, and March 23. The spatial distribution of seismicity following the March 16 event migrated spatially to the north through time, starting near 20oS and moving to ~19.5oS. The initial location of the April 1 earthquake places the event near the northern end of this seismic sequence. Other recent large plate boundary ruptures bound the possible rupture area of the April 1 event, including the 2001 M 8.4 Peru earthquake adjacent to the south coast of Peru to the north, and the 2007 M 7.7 Tocopilla, Chile and 1995 M 8.1 Antofagasta, Chile earthquakes to the south. Other nearby events along the plate boundary interface include an M 7.4 in 1967 as well as an M 7.7 in 2005 in the deeper portion of the subduction zone beneath inland Chile.

Seismotectonics of South America (Nazca Plate Region)
The South American arc extends over 7,000 km, from the Chilean margin triple junction offshore of southern Chile to its intersection with the Panama fracture zone, offshore of the southern coast of Panama in Central America. It marks the plate boundary between the subducting Nazca plate and the South America plate, where the oceanic crust and lithosphere of the Nazca plate begin their descent into the mantle beneath South America. The convergence associated with this subduction process is responsible for the uplift of the Andes Mountains, and for the active volcanic chain present along much of this deformation front. Relative to a fixed South America plate, the Nazca plate moves slightly north of eastwards at a rate varying from approximately 80 mm/yr in the south to approximately 65 mm/yr in the north. Although the rate of subduction varies little along the entire arc, there are complex changes in the geologic processes along the subduction zone that dramatically influence volcanic activity, crustal deformation, earthquake generation and occurrence all along the western edge of South America.
Most of the large earthquakes in South America are constrained to shallow depths of 0 to 70 km resulting from both crustal and interplate deformation. Crustal earthquakes result from deformation and mountain building in the overriding South America plate and generate earthquakes as deep as approximately 50 km. Interplate earthquakes occur due to slip along the dipping interface between the Nazca and the South American plates. Interplate earthquakes in this region are frequent and often large, and occur between the depths of approximately 10 and 60 km. Since 1900, numerous magnitude 8 or larger earthquakes have occurred on this subduction zone interface that were followed by devastating tsunamis, including the 1960 M9.5 earthquake in southern Chile, the largest instrumentally recorded earthquake in the world. Other notable shallow tsunami-generating earthquakes include the 1906 M8.5 earthquake near Esmeraldas, Ecuador, the 1922 M8.5 earthquake near Coquimbo, Chile, the 2001 M8.4 Arequipa, Peru earthquake, the 2007 M8.0 earthquake near Pisco, Peru, and the 2010 M8.8 Maule, Chile earthquake located just north of the 1960 event.

Large intermediate-depth earthquakes (those occurring between depths of approximately 70 and 300 km) are relatively limited in size and spatial extent in South America, and occur within the Nazca plate as a result of internal deformation within the subducting plate. These earthquakes generally cluster beneath northern Chile and southwestern Bolivia, and to a lesser extent beneath northern Peru and southern Ecuador, with depths between 110 and 130 km. Most of these earthquakes occur adjacent to the bend in the coastline between Peru and Chile. The most recent large intermediate-depth earthquake in this region was the 2005 M7.8 Tarapaca, Chile earthquake.

Earthquakes can also be generated to depths greater than 600 km as a result of continued internal deformation of the subducting Nazca plate. Deep-focus earthquakes in South America are not observed from a depth range of approximately 300 to 500 km. Instead, deep earthquakes in this region occur at depths of 500 to 650 km and are concentrated into two zones: one that runs beneath the Peru-Brazil border and another that extends from central Bolivia to central Argentina. These earthquakes generally do not exhibit large magnitudes. An exception to this was the 1994 Bolivian earthquake in northwestern Bolivia. This M8.2 earthquake occurred at a depth of 631 km, which was until recently the largest deep-focus earthquake instrumentally recorded (superseded in May 2013 by a M8.3 earthquake 610 km beneath the Sea of Okhotsk, Russia), and was felt widely throughout South and North America.
Subduction of the Nazca plate is geometrically complex and impacts the geology and seismicity of the western edge of South America. The intermediate-depth regions of the subducting Nazca plate can be segmented into five sections based on their angle of subduction beneath the South America plate. Three segments are characterized by steeply dipping subduction; the other two by near-horizontal subduction.

The Nazca plate beneath northern Ecuador, southern Peru to northern Chile, and southern Chile descend into the mantle at angles of 25° to 30°. In contrast, the slab beneath southern Ecuador to central Peru, and under central Chile, is subducting at a shallow angle of approximately 10° or less. In these regions of "flat-slab" subduction, the Nazca plate moves horizontally for several hundred kilometers before continuing its descent into the mantle, and is shadowed by an extended zone of crustal seismicity in the overlying South America plate. Although the South America plate exhibits a chain of active volcanism resulting from the subduction and partial melting of the Nazca oceanic lithosphere along most of the arc, these regions of inferred shallow subduction correlate with an absence of volcanic activity.

Source: U.S. Geological Survey
 
Support : Creating Website | Johny Template | Mas Template
Copyright © 2011. The planet wall - All Rights Reserved
Template Created by Easy Blogging Published by Mas Template
Proudly powered by Blogger