Latest Post
Showing posts with label ATMOSPHERE. Show all posts

NOAA’s investments in weather models and partnerships paying off

Written By Unknown on Tuesday, February 3, 2015 | 2:24 AM

Early improvements effective in forecasting recent Nor’easter; future forecast model upgrades planned
As the Northeast digs out from this week’s blizzard, a new NOAA-led effort to improve the forecasting of such high impact weather events is reaching an important early benchmark. One of the first major improvements - upgrading the resolution of three global forecast models -- has already shown its effectiveness. One of these models, the newly upgraded Global Forecast System (GFS) model, provided one of the most precise forecasts of the track, intensity, precipitation, and distribution of the Nor’easter. The other research models provided important forecast information, as well.

“The Global Forecast System did remarkably well in the recent Nor’easter,” said Louis Uccellini, director of NOAA’s National Weather Service. “This is due to the recent improvements we’ve made to the GFS, including higher resolution, improved physics, and better access to new data. With the help of scientists at NOAA Research, we’re making improvements to all our models, and upgrading supercomputers to improve our ability to translate data into actionable information, and to produce more timely, accurate and reliable forecasts.”

By the end of January, the $13 million project called the High Impact Weather Prediction Project (HIWPP), funded by Congress in the wake of Hurricane Sandy, will have improved the resolution on the global forecast model operated by NOAA Research Earth System Research Laboratory and the model operated by the U.S. Navy.
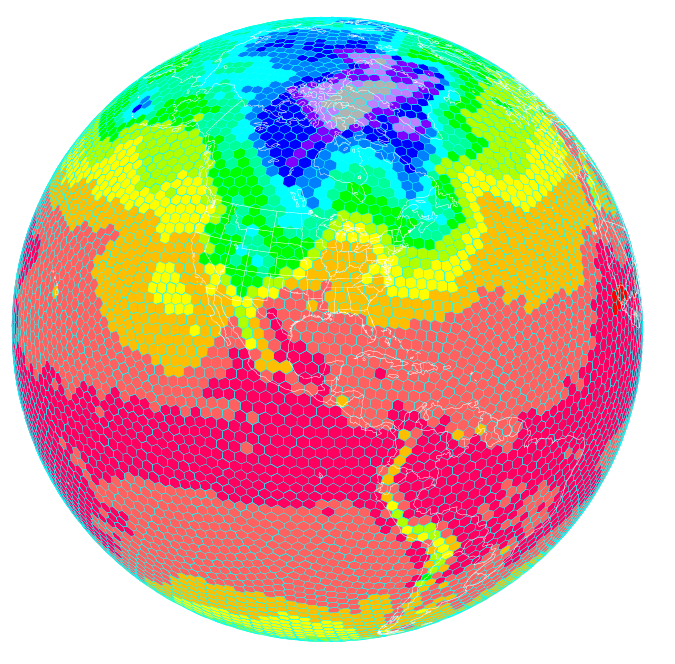
Improving global models
Scientists at NOAA’s Earth System Research Laboratory are running a high resolution global forecast model called the FIM, or Flow following finite volume Icoschedral Model. As depicted here, the FIM uses a unique grid that allows for a more uniform representation of the Earth. Higher resolution models are helping improve severe weather prediction. (NOAA)

In addition, NOAA researchers have written and installed programs to enable these three global models to work together effectively, which provides greater accuracy and confidence in forecasts. The third improvement is a plan to actively involve the broader weather forecasting community, including other public, academic and private sector scientists, in the evaluation of how these models work together to refine and improve forecasts.

“We are always looking for ways to improve the reliability and accuracy of our forecasts and models,” said John Cortinas, director of NOAA’s Office of Weather and Air Quality, who is overseeing HIWPP, which involves researchers from NOAA’s Oceanic and Atmospheric Research, NOAA’s National Weather Service, cooperative institutes, other government and academic partners.

“The goal of the project is to develop the next generation of weather forecast models that will eventually extend our ability to skillfully forecast high-impact weather out to several weeks and beyond,” Cortinas said. “By extending lead time for forecasts on storms like the one we’ve just experienced, cities and towns can better plan for these events, potentially saving lives and helping protect valuable land, homes and businesses. Businesses and industry can better plan everything from shipping to safe routing of air traffic to energy consumption. For ordinary citizens, it will be easier to plan an event or a trip.”

Over the last decades, weather forecasts have improved steadily so that we now have accurate forecasts out to five days, with reasonable accuracy to seven days. “We’ve gained about a day a decade in accuracy,” said Timothy Schneider, a research meteorologist at NOAA’s Earth System Research Laboratory, who is working to improve global forecast models. “Gaining a day of accuracy involves a combination of improving the science, adding computer power and increasing the necessary observations. With this project, we’re trying to accelerate this progress to make quicker gains.”

Global weather data key to improved local forecasts

“We know we can get better weather forecasts by improving the resolution of global forecast models so they depict weather in finer and finer detail,” explained Schneider. The resolution of NOAA’s two global forecast models has improved from grids that are 24 kilometers, to ones that are about 13 kilometers.  “The finer you chop up the picture, the more you can see of what is happening inside a particular storm. This helps us make better forecasts.”

 “If we’re going to predict weather out beyond seven and 10 days, we need even better global weather forecast models that show us what’s occurring on the other side of the Earth,” added Schneider. “Weather patterns on one side of the globe travel around the Earth and evolve. Storms born in the western Pacific follow air patterns that can create major winter storms on the West Coast, and weather patterns off the coast of Africa can spawn hurricanes in the U.S.”

Source: NOAA

NCDC Releases 2014 U.S. Climate Report

Written By Unknown on Monday, February 2, 2015 | 9:20 PM

The 2014 annual average contiguous U.S. temperature was 52.6°F, 0.5°F above the 20th century average. This ranked as the 34th warmest year in the 1895–2014 record. Very warm conditions dominated the West, while the Midwest and Mississippi Valley were cool.

The average contiguous U.S. precipitation was 30.76 inches, 0.82 inch above average, and ranked as the 40th wettest year in the 120-year period of record. The northern United States was wet, and the Southern Plains were dry; the national drought footprint shrank about 2 percent. 

In 2014, there were eight weather and climate disaster events with losses exceeding $1 billion each across the United States. These eight events resulted in the deaths of 53 people. The events include: the western U.S. drought, the Michigan and Northeast flooding event, five severe storm events, and one winter storm event. 

This summary from NOAA's National Climatic Data Center is part of the suite of climate services NOAA provides to government, business, academia, and the public to support informed decision making.

Source: NOAA


Atmospheric warming heats the bottom of ice sheets, as well as the top

Written By Unknown on Saturday, January 31, 2015 | 4:27 PM

A 70-meter-deep basin formed near the summit of Greenland’s Flade Isblink Ice Cap in the fall of 2012 when a lake 540 meters beneath the ice surface suddenly emptied. Summer meltwater streams on the ice cap surface (blue) enter crevasses near the bottom of the image. Photo Credit: WorldView-2 Imagery (c) 2014, DigitalGlobe, Inc.
University of Minnesota researchers are part of a national team of scientists that has published a new paper showing for the first time that meltwater from the surface of an ice cap in northeastern Greenland can make its way beneath the ice and become trapped, refilling a subglacial lake. This meltwater provides heat to the bottom of the ice sheet.

These groundbreaking findings provide new information about atmospheric warming and its affect on the critical zone at the base of the ice. The warmth provided by the water could make the ice sheet move faster and alter how it responds to the changing climate.

The research is detailed in a new paper published today online by the journal Nature. The research was led by Cornell University Earth and Atmospheric Sciences researcher Michael Willis, who is also an adjunct faculty member in the geological sciences department at UNC-Chapel Hill's College of Arts and Sciences. The research study’s co-authors are Bradley Herried, University of Minnesota School of Earth Science’s Polar Geospatial Center; Michael Bevis, Ohio State University School of Earth Sciences; and Robin Bell, Columbia University Lamont Doherty Earth Observatory.

“We’re seeing surface meltwater make its way to the base of the ice where it can get trapped and stored at the boundary between the bedrock beneath the ice sheet and the ice itself,” Willis said. “As the lake beneath the ice fills with surface meltwater, the heat released by this trapped meltwater can soften surrounding ice, which may eventually cause an increase in ice flow.”

The researchers were able to pinpoint when the subglacial lake refilled using data collected from high-resolution satellite images from the University of Minnesota’s Polar Geospatial Center, as well as data from NASA’s operation IceBridge for calibration and verification.

The direct link between the surface meltwater and the filling of a lake at the base of the ice has never been seen before. Over the last few years the number of lakes on the surface of the Greenland ice sheet has greatly increased. Surface lakes are also occurring much farther inland at higher altitudes than in the past. If this mechanism of transferring water and warmth from the surface lakes to the bottom of the ice sheet is common then the Greenland Ice Sheet is likely to respond more rapidly to climate change than is currently predicted.

The Greenland ice sheet comprises about 80 percent of the land mass of Greenland and previous studies have documented that the ice sheet is melting at a faster rate due to climate change. The movement of meltwater beneath the ice sheet, from the interior to the ocean, is the topic of many investigations as it can control the speed at which the ice sheet moves. This is the first study to document that surface water can penetrate to the bottom of an ice cap and be trapped in place. Researchers say this process could also occur at other large bodies of ice.

The study was sparked in 2012 when Willis was mapping ice changes around the edge of the Greenland Ice Sheet as part of a study funded by U.S. National Science Foundation (NSF) to understand how much of the accelerating ice loss in Greenland is caused by melting and how much is caused by the increase of ice moving into the ocean.

During his research, Willis spotted a 70-meter-deep hole (the equivalent of a 10-story building) that had formed when a subglacial lake, far beneath the ice surface, emptied in the late fall of 2011. Subglacial lakes are rare in Greenland, and the presence of such a lake in the far northeast came as a surprise. The ice in this region is much too slow, too cold and too thin to allow melting beneath the ice cap, which is how a subglacial lake usually forms. 

Between 2012 and 2014, Willis watched as summer meltwater on the surface of the ice made its way down cracks around the hole and refilled the empty lake basin at the base of the ice cap. When water was flowing on the surface, the subglacial lake filled. When water stopped flowing on the surface, the subglacial lake stopped refilling.

Each summer scientists see bright blue streams form on the surface of Greenland as warm air melts the ice sheet. What happens to this water when it disappears into cracks in the ice has remained a mystery.

“This discovery that water can be stored in lakes beneath the ice shows how the plumbing on the surface is linked to the plumbing at the base," said co-author Bell.

The Cornell-led team calculated that the lake beneath the ice has filled about half way since its 2011 blowout that originally drove water from the lake at a volume of 215 cubic meters per second (nearly 57,000 gallons—close to the volume of a 30-foot-by-50-foot backyard swimming pool every second.)  As the lake refills, the surface meltwater carries stored heat, called latent heat, along with it from the relatively warm atmosphere to the icy depths. This latent heat reduces the stiffness of the surrounding ice and makes the ice more likely to flow out to sea.

Even though researchers have long known of the existence of subglacial lakes, never before have they witnessed any refilling from the surface. The refilling signals to researchers that Greenland’s ice loss has likely reached a milestone.

"We can actually see the meltwater pour down into these holes and then watch these subglacial lakes drain out and fill up again in real time,” said study co-author Bevis. “With melting like that, even the deep interior of the ice sheet is going to change. If enough water is pouring down into the Greenland Ice Sheet for us to see the same subglacial lake empty and refill itself over and over, then there must be so much latent heat being released under the ice that we’d have to expect it to change the large-scale behavior of the ice sheet.”

Source: University of Minnesota

NASA's SDO sees massive filament erupt on sun

Written By Unknown on Sunday, January 4, 2015 | 5:53 AM

Eruptive events on the sun can be wildly different. Some come just with a solar flare, some with an additional ejection of solar material called a coronal mass ejection (CME), and some with complex moving structures in association with changes in magnetic field lines that loop up into the sun's atmosphere, the corona. Credit: Image courtesy of NASA/Goddard Space Flight Center
Eruptive events on the sun can be wildly different. Some come just with a solar flare, some with an additional ejection of solar material called a coronal mass ejection (CME), and some with complex moving structures in association with changes in magnetic field lines that loop up into the sun's atmosphere, the corona.

On July 19, 2012, an eruption occurred on the sun that produced all three. A moderately powerful solar flare exploded on the sun's lower right limb, sending out light and radiation. Next came a CME, which shot off to the right out into space. And then, the sun treated viewers to one of its dazzling magnetic displays -- a phenomenon known as coronal rain.

Over the course of the next day, hot plasma in the corona cooled and condensed along strong magnetic fields in the region. Magnetic fields, themselves, are invisible, but the charged plasma is forced to move along the lines, showing up brightly in the extreme ultraviolet wavelength of 304 Angstroms, which highlights material at a temperature of about 50,000 Kelvin. This plasma acts as a tracer, helping scientists watch the dance of magnetic fields on the sun, outlining the fields as it slowly falls back to the solar surface.

Source: NASA/Goddard Space Flight Center

Gecko grippers get a microgravity test flight

Written By Unknown on Monday, December 29, 2014 | 5:57 AM

Scientists at NASA's Jet Propulsion Laboratory in Pasadena, California, are working on adhesive gripping tools that could grapple objects such as orbital debris or defunct satellites that would otherwise be hard to handle.
Credit: Image courtesy of NASA/Jet Propulsion Laboratory
There are no garbage trucks equipped to leave the atmosphere and pick up debris floating around Earth. But what if we could send a robot to do the job?

Scientists at NASA's Jet Propulsion Laboratory in Pasadena, California, are working on adhesive gripping tools that could grapple objects such as orbital debris or defunct satellites that would otherwise be hard to handle.

The gecko gripper project was selected for a test flight through the Flight Opportunities Program of NASA's Space Technology Mission Directorate. As a test, researchers used the grippers in brief periods of weightlessness aboard NASA's C-9B parabolic flight aircraft in August.

"Orbital debris is a serious risk to spacecraft, including the International Space Station," said Aaron Parness, a JPL robotics researcher who is the principal investigator for the grippers. "This is definitely a problem we're going to have to deal with. Our system might one day contribute to a solution."

The gripping system developed by Parness and colleagues was inspired by geckos, lizards that cling to walls with ease. Geckos' feet have branching arrays of tiny hairs, the smallest of which are hundreds of times thinner than a human hair. This system of hairs can conform to a rough surface without a lot of force. Although researchers cannot make a perfect replica of the gecko foot, they have put "hair" structures on the adhesive pads of the grippers.

The synthetic hairs, also called stalks, are wedge-shaped and have a slanted, mushroom-shaped cap. When the gripping pad lightly touches part of an object, only the very tips of the hairs make contact with that surface.

"The stickiness of the grippers can be turned on and off, by changing the direction in which you pull the hairs," Parness said.

To get the gripper to stick to a surface, force is applied to the adhesive pad material in a manner that makes the hairs bend. This increases the real area of contact between the hairs and the surface, which corresponds to greater adhesion. When the force is relaxed and the hairs go back to being upright, this process turns off the stickiness.

A phenomenon called van der Waals forces, named for Nobel Prize-winning physicist Johannes Diderik van der Waals, explains the non-permanent stickiness of the grippers, as well as gecko feet. These temporary adhesive forces happen because electrons orbiting the nuclei of atoms are not evenly spaced, creating a slight electrical charge. Such forces persist even in extreme temperature, pressure and radiation conditions.

"The reliability of van der Waals forces, even in severe environments, makes them particularly useful for space applications," Parness said.

"The system could grapple objects in space that are spinning or tumbling, and would otherwise be hard to target," he said.

In the recent tests, the grippers were able to grapple a 20-pound cube as it floated. The grippers also were able to grapple a researcher wearing a vest made of spacecraft material panels, representing a 250-pound "object." 

Members of the research team held the device with adhesive pads during the test, but the eventual idea is to integrate the grippers into a robotic arm or leg.
In total, the grippers have been tested on more than 30 spacecraft surfaces at JPL. They also have been tested successfully in a JPL thermal vacuum chamber, with total vacuum conditions and temperatures of minus 76 degrees Fahrenheit (minus 60 degrees Celsius) to simulate the conditions of space. While Parness was in graduate school at Stanford University in Palo Alto, California, the grippers were tested separately in more than 30,000 cycles of "on" and "off," with the adhesive staying strong. Several prototypes have since been designed.
There are more than 21,000 pieces of orbital debris larger than 3.9 inches (10 centimeters) in Earth's orbit. The U.S. Space Surveillance Network routinely tracks these objects. In 2009, an accidental collision occurred between an operational communications satellite and a large piece of debris, destroying the satellite.

Besides grappling orbital debris, the grippers could help inspect spacecraft or assist small satellites in docking to the International Space Station. The grippers are another example of how technology drives exploration.
The California Institute of Technology manages JPL for NASA.

Dolphins are attracted to magnets: Add dolphins to the list of magnetosensitive animals, French researchers say

Written By Unknown on Wednesday, December 24, 2014 | 5:32 PM

Bottlenose dolphins
Add dolphins to the list of magnetosensitive animals, French researchers say. Dolphins are indeed sensitive to magnetic stimuli, as they behave differently when swimming near magnetized objects. So says Dorothee Kremers and her colleagues at Ethos unit of the Universitรฉ de Rennes in France, in a study in Springer's journal Naturwissenschaften -- The Science of Nature. Their research, conducted in the delphinarium of Planรจte Sauvage in France, provides experimental behavioral proof that these marine animals are magnetoreceptive.

Magnetoreception implies the ability to perceive a magnetic field. It is supposed to play an important role in how some land and aquatic species orientate and navigate themselves. Some observations of the migration routes of free-ranging cetaceans, such as whales, dolphins and porpoises, and their stranding sites suggested that they may also be sensitive to geomagnetic fields.

Because experimental evidence in this regard has been lacking, Kremers and her colleagues set out to study the behavior of six bottlenose dolphins in the delphinarium of Planรจte Sauvage in Port-Saint-Pรจre. This outdoor facility consists of four pools, covering 2,000 m² of water surface. They watched the animals' spontaneous reaction to a barrel containing a strongly magnetized block or a demagnetized one. Except from this characteristic, the blocks were identical in form and density. The barrels were therefore indistinguishable as far as echolocation was concerned, the method by which dolphins locate objects by bouncing sound waves off them.

During the experimental sessions, the animals were free to swim in and out of the pool where the barrel was installed. All six dolphins were studied simultaneously, while all group members were free to interact at any time with the barrel during a given session. The person who was assigned the job to place the barrels in the pools did not know whether it was magnetized or not. This was also true for the person who analyzed the videos showing how the various dolphins reacted to the barrels.

The analyses of Ethos team revealed that the dolphins approached the barrel much faster when it contained a strongly magnetized block than when it contained a similar not magnetized one. However, the dolphins did not interact with both types of barrels differently. They may therefore have been more intrigued than physically drawn to the barrel with the magnetized block.

"Dolphins are able to discriminate between objects based on their magnetic properties, which is a prerequisite for magnetoreception-based navigation," says Kremers. "Our results provide new, experimentally obtained evidence that cetaceans have a magenetic sense, and should therefore be added to the list of magnetosensitive species."

Source: Springer Science+Business Media

Predicting the predator threatening a squirrel by analyzing its sounds and tail movements

Thaddeus McRae poses in the Gifford Arboretum with his remote-controlled cat, after being interviewed by WSVN. Credit: University of Miami College of Arts and Sciences
Everyone has watched squirrels playfully climbing trees, gracefully leaping from branch to branch, and scurrying across parks. Thaddeus McRae, Ph.D '12, adjunct assistant research professor of biology in the University of Miami College of Arts Sciences, has taken these observations to a scientific level.

McRae studied squirrel colonies on the Coral Gables campus to see how their sounds and tail movements differ in response to different kinds of threats. He is looking to discover why squirrels interact using both vocalizations and gestures.

"These multimodal signals, which simultaneously send information via two or more sensory modalities to communicate, are ubiquitous," McRae said, adding that people and other mammals, birds, insects and spiders -- and even some plants -- communicate in this manner.

The different sounds, expressions and gestures might "reinforce each other, or maybe they contain different information, or maybe they reach different audiences," he said.

To conduct his research -- the basis of his Ph.D. dissertation -- McRae designed a unique tool: a remote-controlled cat, which he used to chase squirrels while recording their reactions to ground-based predators. Gliders painted to resemble hawks showed the squirrels' responses to threats from the air.

McRae has become somewhat of a local celebrity scientist, with recent and upcoming stories about his study appearing on the Miami New Times "Riptide" blog, and WSVN. He sees three reasons for this media attention.

Squirrels "are often most abundant in the same places people are most abundant," McRae said, adding that they're "cute and fuzzy with a bushy tail, which for some people goes a long way toward earning goodwill."

He also conducted his research in a "very public setting, outdoors on UM's campus in the middle of the city." McRae believes that this helps to breakdown the "mysterious aura" of science, "putting scientific curiosity out there where passersby can see it and become curious themselves."

Finally, he admits that "there's something a little bit humorous" about his research process and his unusual tools.

"To me, this squirrel study isn't cool because I used remote control cats, although enjoying whatever tools you use is nice, it's cool because we learned something about squirrels that we didn't know before," McRae said.

Over two years of observation McRae, working closely with Professor of Biology Steven Green, found that he could quite accurately predict what type of predator was threatening a squirrel by analyzing its sounds and tail movements.

He measured the response of three distinct squirrel sounds: the "kuk" (a short bark), the "quaa" (a longer squeal) and the "moan" (a whistling sound).

He also looked for specific patterns for tail motions in combination with these noises. The "twitch" involves a controlled movement in an arc shape, while the "flag" can take the shape of an arc, figure eight, circle or squiggle.

McRae theorizes that the squirrels use the vocal and tail alarm calls for two purposes -- to let predators know that they have been spotted, and to warn other squirrels of danger in the area. To this end, he is now conducting follow-up research to determine how squirrels react to distress signals from their peers.

For both his current study and his dissertation research, McRae has worked extensively with undergraduate research assistants.

"I try to give them a taste of various steps in the process, from thinking about the organisms and asking questions, to collecting data, to the sometimes tedious task of converting those data into analyzable form, to drawing conclusions. I share with them the joy of discovery," he said.

"Even a small, fast research project can show us something we never knew before. It may not shake the earth, but it's another tiny piece of understanding. ... For a young student to be one of the first handful of people on Earth to share even a small discovery is, frankly, freaking awesome."

Source: University of Miami

'Probiotics' for plants boost detox abilities; untreated plants overdose and die

Written By Unknown on Tuesday, December 23, 2014 | 7:41 PM

The Doty lab conducts work to see how plants treated with naturally occurring endophytes might handle soils contaminated with a variety of pollutants. Graduate student Robert Tournay, for example, is interested in how the plants handle arsenic. Credit: M Levin/U of Washington
Scientists using a microbe that occurs naturally in eastern cottonwood trees have boosted the ability of two other plants -- willow and lawn grass -- to withstand the withering effects of the nasty industrial pollutant phenanthrene and take up 25 to 40 percent more of the pollutant than untreated plants.

The approach could avoid the regulatory hurdles imposed on transgenic plants -- plants with genes inserted from or exchanged with other plant or animal species -- that have shown promise in phytoremediation, the process of using plants to remove toxins from contaminated sites, according to Sharon Doty, associate professor of environmental and forestry sciences and corresponding author on a paper about the new work in Environmental Science & Technology.

"Our approach is much like when humans take probiotic pills or eat yogurt with probiotics to supplement the 'good' microbes in their guts," she said.

The microbe from the cottonwood was encouraged to colonize the roots of willows simply by dipping rooted and trimmed cuttings in solutions with the microbe. Grasses were treated with microbes in solution as seeds sprouted in soil. Once integrated into the plants, the microbe supplemented their own microbial defenses.

Microbes that take up residence in the inner tissue of plants and don't cause negative symptoms are called endophytes. In nature, endophytes have a welcomed, symbiotic relationship with plants. In polluted soil, for instance, if the right endophytes are present they consume toxins coming up through plant roots. The endophytes get fed and the plant gets help neutralizing pollutants that could kill it.

That's been one challenge of phytoremediation: plants removing pollutants can, all too quickly, succumb to the toxins.

"When the endophyte in these experiments was given to willow and grasses, it reduced the phytotoxic effects of phenanthrene compared to the control plants that did not receive the endophyte and died," said lead author Zareen Khan, a UW research scientist in environmental and forest sciences.

Phenanthrene is carcinogenic, on the Environmental Protection Agency's priority pollutants list and belongs to a class of polycyclic aromatic hydrocarbons that get deposited into the environment via fossil fuel combustion, waste incineration or as byproducts of industrial processes. Soils that become contaminated can be capped with layers of uncontaminated soil or dug up and removed for cleaning at soil remediation facilities or storage at waste disposal facilities.

In their search, UW researchers tested six different endophytes from cottonwood and willow varieties and found one -- lab name PD1 -- from the eastern cottonwood to be superior at breaking down phenanthrene.

They introduced this endophyte into willow cuttings and lawn grass. Willows were chosen because some varieties have already proven adept at removing toxins and the shrubs have extensive root systems, take up a lot of water and grow rapidly. Lawn grass was included because it also grows fast and could be useful in parks and open-space areas.

In lab experiments, the willow cuttings with added endophyte protection continued to grow, kept their leaves and had denser root systems. Untreated plants wilted, lost leaves and their roots turned brown. When soils were analyzed, the treated willows took up 65 percent of the phenanthrene compared with untreated plants that removed 40 percent, an improvement of 25 percent.

Grass seed planted in contaminated soils and watered with solutions containing the PD1 endophyte germinated five days quicker, grew taller and had 100 more tillers, or new offshoots, after 13 days. Treated grass removed 50 percent of the phenanthrene from the soil, compared with untreated grass that removed 10 percent, an improvement of 40 percent.

In phytoremediation, plants that take up pollutants but don't degrade them have to be removed and treated as hazardous waste or otherwise disposed of safely. The willows treated in the UW experiment appear to have degraded some 90 percent of the phenanthrene to harmless components. The researchers said they'd like to determine if that promising finding holds up in mass-balance studies and want to examine the possible effects on bugs or animals that might bite the plants processing the toxins and other environmental considerations. Interestingly, other studies have shown that bugs can smell similar semi-volatile pollutants and avoid eating the plants containing them, Doty said.

The work was funded by a Small Business Innovation Research grant from the National Institute of Environmental Health Sciences and by funds provided through the Byron and Alice Lockwood Endowed Professorship that Doty holds. The other four co-authors on the paper were undergraduate volunteers: David Roman and Trent Kintz have since graduated while May delas Alas and Raymond Yap are still working on their bachelor's degrees.
Just down the road from UW is Seattle's Gas Works Park, a site Doty thinks is a prime candidate for the approach her lab reported. Contaminants in the soil, including phenanthrene, are from a now-dismantled gasification plant. Soils have been covered with uncontaminated soil.

"The idea of leaving a known carcinogen in a public place is not right," she said. "What about problems of erosion? We should do what we can to remove it. We spend so much money treating cancer, I'd like us to take steps to prevent it instead."

Source: University of Washington

Microplastics in the ocean: Biologists study effects on marine animals

Written By Unknown on Monday, December 22, 2014 | 12:00 AM

A marine isopod of the genus Idotea with food pellets.
Credit: Photo Alfred Wegener Institute / Julia Hรคmer
Ingestion of microplastic particles does not mechanically affect marine isopods. This was the result of a study by biologists at the North Sea Office of the Alfred Wegener Institute, Helmholtz Centre for Polar and Marine Research (AWI) that was published recently in the journal Environmental Science and Technology. The study marks the launch of a series of investigations aimed at forming a risk matrix on the sensitivity of different marine species to microplastic pollution.

Uptake of large plastic items by birds and fish may cause blockage of the gastrointestinal tract and severe starvation of the animals. "We were wondering whether small plastic particles have a comparable effect on smaller animals," says Dr. Lars Gutow from AWI's North Sea Office. "Only very limited research has been done on the effects of microplastics on living beings. Accordingly, there is great uncertainty about the implications for marine animals," the biologist explains the motivation for the study.

Lars Gutow and his colleagues selected the isopod Idotea emarginata as their model organism for an initial case study. In feeding experiments the researchers offered the isopods artificial algal food supplemented with plastic particles. The food contained three different kinds of microplastics in varying concentrations. They used industrially produced polystyrene particles with a diameter of ten micrometers as well as self-made fragments and fibres made of polyethylene and polyacryl, respectively.

The researchers studied the fate of the different materials under a light microscope, with the help of a fluorescence microscope, and with an electron microscope. They were able to trace the path of the microplastic particles through the isopods and determine the concentrations of the particles in different sections of the digestive system. The study showed that the concentration of microplastics in the faecal material of the isopods was as high as in the food. The scientists found small amounts of microplastics both in the stomach and in the gut of the animals. However, they did not detect any microparticles in the digestive glands. "The isopods ingested and excreted the artificial food with the microplastic particles without absorbing or accumulating the particles," Gutow summarises the results. Thus, plastic particles in the specific size range studied do not represent a direct mechanical risk for isopods and probably not for other crustaceans either. "In the case of Idotea emarginata, the microplastic particles did not enter the digestive gland, which is the principle organ in crustaceans where digestion and resorption of nutrients takes place," states the biologist from AWI's North Sea Office.

In a long-term experiment the scientists could also show that isopods did not display any long-term effects even after feeding on microplastic enriched food for six to seven weeks. 

Fitness parameters such as survival rate and growth did not differ between animals that were fed with and without microplastics, respectively. In an earlier study, however, AWI biologist Prof. Dr. Angela Kรถhler demonstrated that mussels show inflammatory reactions if they take up and absorb high concentrations of microplastic in an experiment. This clearly shows that different animal species react differently to microplastics. "In contrast to filter feeding mussels, isopods of the genus Idotea probably take up more frequently indigestible particles with their food in their natural habitat and may, thus, have adapted accordingly," elucidates Gutow.

But the biologists are not only interested in the feeding type: "We want to study systematically how the life style, habitat, physiology and anatomy of different marine organisms influence the uptake and utilisation of microplastic particles in order to come up with a risk matrix for diverse types of organisms," says Lars Gutow. "Therefore, it will be necessary to also study the possible chemical (toxic) and biochemical effects in addition to the physical effects that we looked at," he outlines future tasks.

Source: Alfred Wegener Institute, Helmholtz Centre for Polar and Marine Research

Small volcanic eruptions could be slowing global warming

Written By Unknown on Sunday, December 21, 2014 | 11:21 PM

The Sarychev Peak Volcano, on Matua Island, erupted on June 12, 2009. New research shows that eruptions of this size may contribute more to the recent lull in global temperature increases than previously thought. Credit: NASA
Small volcanic eruptions might eject more of an atmosphere-cooling gas into Earth's upper atmosphere than previously thought, potentially contributing to the recent slowdown in global warming, according to a new study.

Scientists have long known that volcanoes can cool the atmosphere, mainly by means of sulfur dioxide gas that eruptions expel. Droplets of sulfuric acid that form when the gas combines with oxygen in the upper atmosphere can remain for many months, reflecting sunlight away from Earth and lowering temperatures. However, previous research had suggested that relatively minor eruptions -- those in the lower half of a scale used to rate volcano "explosivity" -- do not contribute much to this cooling phenomenon.
Now, new ground-, air- and satellite measurements show that small volcanic eruptions that occurred between 2000 and 2013 have deflected almost double the amount of solar radiation previously estimated. By knocking incoming solar energy back out into space, sulfuric acid particles from these recent eruptions could be responsible for decreasing global temperatures by 0.05 to 0.12 degrees Celsius (0.09 to 0.22 degrees Fahrenheit) since 2000, according to the new study accepted to Geophysical Research Letters, a journal of the American Geophysical Union.
These new data could help to explain why increases in global temperatures have slowed over the past 15 years, a period dubbed the 'global warming hiatus,' according to the study's authors.

The warmest year on record is 1998. After that, the steep climb in global temperatures observed over the 20th century appeared to level off. Scientists previously suggested that weak solar activity or heat uptake by the oceans could be responsible for this lull in temperature increases, but only recently have they thought minor volcanic eruptions might be a factor.
Climate projections typically don't include the effect of volcanic eruptions, as these events are nearly impossible to predict, according to Alan Robock, a climatologist at Rutgers University in New Brunswick, N.J., who was not involved in the study. Only large eruptions on the scale of the cataclysmic 1991 Mount Pinatubo eruption in the Philippines, which ejected an estimated 20 million metric tons (44 billion pounds) of sulfur, were thought to impact global climate. But according to David Ridley, an atmospheric scientist at the Massachusetts Institute of Technology in Cambridge and lead author of the new study, classic climate models weren't adding up.
"The prediction of global temperature from the [latest] models indicated continuing strong warming post-2000, when in reality the rate of warming has slowed," said Ridley. That meant to him that a piece of the puzzle was missing, and he found it at the intersection of two atmospheric layers, the stratosphere and the troposphere- the lowest layer of the atmosphere, where all weather takes place. Those layers meet between 10 and 15 kilometers (six to nine miles) above the Earth.

Traditionally, scientists have used satellites to measure sulfuric acid droplets and other fine, suspended particles, or aerosols, that erupting volcanoes spew into the stratosphere. But ordinary water-vapor clouds in the troposphere can foil data collection below 15 km, Ridley said. "The satellite data does a great job of monitoring the particles above 15 km, which is fine in the tropics. However, towards the poles we are missing more and more of the particles residing in the lower stratosphere that can reach down to 10 km."

To get around this, the new study combined observations from ground-, air- and space-based instruments to better observe aerosols in the lower portion of the stratosphere.
Four lidar systems measured laser light bouncing off aerosols to estimate the particles' stratospheric concentrations, while a balloon-borne particle counter and satellite datasets provided cross-checks on the lidar measurements. A global network of ground-based sun-photometers, called AERONET, also detected aerosols by measuring the intensity of sunlight reaching the instruments. Together, these observing systems provided a more complete picture of the total amount of aerosols in the stratosphere, according to the study authors.
Including these new observations in a simple climate model, the researchers found that volcanic eruptions reduced the incoming solar power by -0.19 ± 0.09 watts of sunlight per square meter of the Earth's surface during the 'global warming hiatus', enough to lower global surface temperatures by 0.05 to 0.12 degrees Celsius (0.09 to 0.22 degrees Fahrenheit). By contrast, other studies have shown that the 1991 Mount Pinatubo eruption warded off about three to five watts per square meter at its peak, but tapered off to background levels in the years following the eruption. The shading from Pinatubo corresponded to a global temperature drop of 0.5 degrees Celsius (0.9 degrees Fahrenheit).
Robock said the new research provides evidence that there may be more aerosols in the atmosphere than previously thought. "This is part of the story about what has been driving climate change for the past 15 years," he said. "It's the best analysis we've had of the effects of a lot of small volcanic eruptions on climate."

Ridley said he hopes the new data will make their way into climate models and help explain some of the inconsistencies that climate scientists have noted between the models and what is being observed.

Robock cautioned, however, that the ground-based AERONET instruments that the researchers used were developed to measure aerosols in the troposphere, not the stratosphere. To build the best climate models, he said, a more robust monitoring system for stratospheric aerosols will need to be developed.

Source; American Geophysical Union

NASA HS3 instrument views two dimensions of clouds

The second Cloud Physics Lidar built to fly on NASA's unmanned Global Hawk aircraft. In this summer's Hurricane and Severe Storm Sentinel or HS3 mission, the CPL is studying the changing profile of the atmosphere in detail to learn more about how hurricanes form and strengthen. Credit: NASA
Looking out the window of a commercial plane during takeoff is like taking the nickel tour of the profile of the atmosphere. As the plane ascends, what may start as a gloomy day on the ground, can turn into rain streaking across the window as you pass through the white-gray cloud, and then sunny skies above once the plane reaches cruising altitude.

NASA's Cloud Physics Lidar (CPL) instrument, flying aboard an unmanned Global Hawk aircraft in this summer's Hurricane and Severe Storm Sentinel, or HS3, mission, is studying the changing profile of the atmosphere in detail to learn more about how hurricanes form and strengthen.

"CPL profiles the atmosphere to get a two-dimensional picture of cloud and aerosols, from the top down," said Matt McGill of NASA's Goddard Space Flight Center in Greenbelt, Maryland, who led the instrument team that designed and built the CPL. Its data, presented as if it were a curtain hanging from the sky, shows what's in the atmosphere's different layers.

From about 60,000 feet on the Global Hawk, twice the altitude of a commercial plane, 94 percent of the atmosphere lies below the instrument. The lidar works by sending rapid pulses of light that, like a radar beam, bounce and scatter off any particles they encounter, such as cloud droplets or dust particles. Some of the scattered light returns to the instrument where it records how long it took for the photons to leave and return -- giving the altitude of the particles.

CPL sends out 5,000 pulses of light per second in three different wavelengths, allowing the science team to discriminate between different types of particles, McGill said. "Is it a cloud made of water? Is it a cloud made of ice or mixed [water and ice]? And we can say something about what type of airborne particle we are seeing. Is it dust or smoke or pollution?"
For the scientists studying hurricanes, those distinctions are important. One of the major areas of study is how Saharan dust off of Africa travels across the Atlantic and affects hurricane formation and intensification. CPL data have been used to verify model projections of Saharan dust in the tropics. The CPL data showed dust layers had a vertical distribution different than models predicted. Instead dust layers occupied narrower altitude ranges. The finding led to an improvement in the dust models, which then feed into hurricane models.

Situated in the nose of the Global Hawk flying over the storm environment, CPL also has a role in on-the-fly mission planning. While in flight, the CPL sends its data back to the team on the ground. "The mission scientists involved in the flight planning can sit there and watch the data with us in real time and say, 'Oh, we're not getting what we want.' Then they can go work with the flight planners and pilots to reroute the aircraft into different areas," said McGill. "They love that."

The airborne science community takes full advantage of the quick look capability, as well as the 24-hour turn around for the final data products. CPL is one of the most flown instruments in NASA's Earth science fleet. "It's a workhorse for the field campaigns," said McGill.

The original CPL was built in 1999 and took its first flight on the ER-2 high altitude research aircraft in 2000. Over the years CPL has been used as a satellite simulator for ground validation efforts, a cloud spotter for other instruments needing a clear view of the ground, as well as the main data collector for scientists studying atmospheric composition and Earth's energy budget where thin clouds and aerosols are major players. The lidar was also part of the proof of concept flights for the A-Train, a series of satellites flying in the same orbit making near-simultaneous measurements of the Earth system using many different instruments. That proof of concept airborne campaign showed scientists the power of combining multiple Earth observing data sets.
In 2007, when talk began of using Global Hawks for Earth science, CPL was among the first sensors considered; its size is perfect for the instrument compartment. Worries about the untested Global Hawk led to a second nearly identical instrument being built for use on the unmanned aircraft. It flew on NASA's maiden Global Hawk Pacific campaign in 2009. Since then, the Global Hawk CPL has flown in two multi-year campaigns, alternating between the Airborne Tropical Tropopause Experiment (ATTREX) and HS3.
Compact and fully autonomous, the CPL lidar design pioneered photon-counting technology that has led to the development of two instruments that will fly in space, the Cloud-Aerosol Transport System (CATS), which launches to the International Space Station this December, and the Advanced Topographic Laser Altimeter System (ATLAS), which will fly on the Ice, Cloud and land Elevation Satellite-2 (ICESat-2) scheduled to launch in 2017.

The solid design of the instrument has borne up surprisingly well over the years, said McGill, who uses CPL as a learning tool for interns and young scientists getting their hands dirty in the field. Together, the twin CPL instruments have flown 26 missions. HS3 will mark the 27th overall and the seventh for the Global Hawk CPL.

"It's still going strong," McGill said.

The HS3 mission is funded by NASA Headquarters and overseen by NASA's Earth System Science Pathfinder Program at NASA's Langley Research Center in Hampton, Virginia, and is one of five large field campaigns operating under the Earth Venture program. The HS3 mission also involves collaborations with partners including the National Centers for Environmental Prediction, Naval Postgraduate School, Naval Research Laboratory, NOAA's Hurricane Research Division and Earth System Research Laboratory, Northrop Grumman Space Technology, National Center for Atmospheric Research, State University of New York at Albany, University of Maryland -- Baltimore County, University of Wisconsin and University of Utah. The HS3 mission is managed by the Earth Science Project Office at NASA's Ames Research Center in Moffett Field, California. The aircraft are maintained and based at NASA's Armstrong Flight Research Center in Edwards, California.

Source: NASA

Magnetic fields frozen into meteorite grains tell a shocking tale of solar system birth

Written By Unknown on Saturday, December 20, 2014 | 7:54 PM

Magnetic field lines (green) weave through the cloud of dusty gas surrounding the newborn Sun. In the foreground are asteroids and chondrules, the building blocks of chondritic meteorites. While solar magnetic fields dominate the region near the Sun, out where the asteroids orbit, chondrules preserve a record of varying local magnetic fields. Credit: Science
The most accurate laboratory measurements yet made of magnetic fields trapped in grains within a primitive meteorite are providing important clues to how the early solar system evolved. The measurements point to shock waves traveling through the cloud of dusty gas around the newborn Sun as a major factor in solar system formation.

The results appear in a paper published Nov. 13 in the journal Science. The lead author is graduate student Roger Fu of MIT, working under Benjamin Weiss; Steve Desch of Arizona State University's School of Earth and Space Exploration is a co-author of the paper.

"The measurements made by Fu and Weiss are astounding and unprecedented," says Desch. 
"Not only have they measured tiny magnetic fields thousands of times weaker than a compass feels, they have mapped the magnetic fields' variation recorded by the meteorite, millimeter by millimeter."

Construction debris
It may seem all but impossible to determine how the solar system formed, given it happened about 4.5 billion years ago. But making the solar system was a messy process, leaving lots of construction debris behind for scientists to study.

Among the most useful pieces of debris are the oldest, most primitive and least altered type of meteorites, called the chondrites (KON-drites). Chondrite meteorites are pieces of asteroids, broken off by collisions, that have remained relatively unmodified since they formed at the birth of the solar system. They are built mostly of small stony grains, called chondrules, barely a millimeter in diameter.

Chondrules themselves formed through quick melting events in the dusty gas cloud -- the solar nebula -- that surrounded the young sun. Patches of the solar nebula must have been heated above the melting point of rock for hours to days. Dustballs caught in these events made droplets of molten rock, which then cooled and crystallized into chondrules.

Tiny magnets
As chondrules cooled, iron-bearing minerals within them became magnetized like bits on a hard drive by the local magnetic field in the gas. These magnetic fields are preserved in the chondrules even down to the present day.

The chondrule grains whose magnetic fields were mapped in the new study came from a meteorite named Semarkona, after the place in India where it fell in 1940. It weighed 691 grams, or about a pound and a half.
The scientists focused specifically on the embedded magnetic fields captured by "dusty" olivine grains that contain abundant iron-bearing minerals. These had a magnetic field of about 54 microtesla, similar to the magnetic field at Earth's surface, which ranges from 25 to 65 microtesla.
Coincidentally, many previous measurements of meteorites also implied similar field strengths. But it is now understood that those measurements detected magnetic minerals contaminated by Earth's magnetic field, or even from hand magnets used by meteorite collectors.

"The new experiments," Desch says, "probe magnetic minerals in chondrules never measured before. They also show that each chondrule is magnetized like a little bar magnet, but with 'north' pointing in random directions."

This shows, he says, they became magnetized before they were built into the meteorite, and not while sitting on Earth's surface.

Shocks and more shocks
"My modeling for the heating events shows that shock waves passing through the solar nebula is what melted most chondrules," Desch explains. Depending on the strength and size of the shock wave, the background magnetic field could be amplified by up to 30 times.
He says, "Given the measured magnetic field strength of about 54 microtesla, this shows the background field in the nebula was probably in the range of 5 to 50 microtesla."

There are other ideas for how chondrules might have formed, some involving magnetic flares above the solar nebula, or passage through the sun's magnetic field. But those mechanisms require stronger magnetic fields than what is measured in the Semarkona samples.

This reinforces the idea that shocks melted the chondrules in the solar nebula at about the location of today's asteroid belt, which lies some two to four times farther from the sun than Earth now orbits.

Desch says, "This is the first really accurate and reliable measurement of the magnetic field in the gas from which our planets formed."

Source: Arizona State University

Sun's rotating 'magnet' pulls lightning towards UK

Big Ben and Houses of Parliament, London, UK. The Sun may be playing a part in the generation of lightning strikes on Earth by temporarily 'bending' the Earth's magnetic field and allowing a shower of energetic particles to enter the upper atmosphere. Credit: © TTstudio / Fotolia
The Sun may be playing a part in the generation of lightning strikes on Earth by temporarily 'bending' the Earth's magnetic field and allowing a shower of energetic particles to enter the upper atmosphere.

This is according to researchers at the University of Reading who have found that over a five year period the UK experienced around 50% more lightning strikes when the Earth's magnetic field was skewed by the Sun's own magnetic field.

The Earth's magnetic field usually functions as an in-built force-field to shield against a bombardment of particles from space, known as galactic cosmic rays, which have previously been found to prompt a chain-reaction of events in thunderclouds that trigger lightning bolts.

It is hoped these new insights, which have been published today, 19 November, in IOP Publishing's journal Environmental Research Letters, could lead to a reliable lightning forecast system that could provide warnings of hazardous events many weeks in advance.

To do so, weather forecasters would need to combine conventional forecasts with accurate predictions of the Sun's spiral-shaped magnetic field known as the heliospheric magnetic field (HMF), which is spewed out as the Sun rotates and is dragged through the solar system by the solar wind.

Lead author of the research Dr Matt Owens said: "We've discovered that the Sun's powerful magnetic field is having a big influence on UK lightning rates.

"The Sun's magnetic field is like a bar magnet, so as the Sun rotates its magnetic field alternately points toward and away from the Earth, pulling the Earth's own magnetic field one way and then another."

In their study, the researchers used satellite and Met Office data to show that between 2001 and 2006, the UK experienced a 50% increase in thunderstorms when the HMF pointed towards the Sun and away from Earth.

This change of direction can skew or 'bend' the Earth's own magnetic field and the researchers believe that this could expose some regions of the upper atmosphere to more galactic cosmic rays--tiny particles from across the Universe accelerated to close to the speed of light by exploding stars.

"From our results, we propose that galactic cosmic rays are channelled to different locations around the globe, which can trigger lightning in already charged-up thunderclouds. The changes to our magnetic field could also make thunderstorms more likely by acting like an extra battery in the atmospheric electric circuit, helping to further 'charge up' clouds," Dr Owens continued.

The results build on a previous study by University of Reading researchers, also published in Environmental Research Letters, which found an unexpected link between energetic particles from the Sun and lightning rates on Earth.
Professor Giles Harrison, head of Reading's Department of Meteorology and co-author of both studies, said: "This latest finding is an important step forward in our knowledge of how the weather on Earth is influenced by what goes on in space. The University of Reading's continuing success in this area shows that new insights follow from atmospheric and space scientists working together."
Dr Owens continued: "Scientists have been reliably predicting the solar magnetic field polarity since the 1970s by watching the surface of the Sun. We just never knew it had any implications on the weather on Earth. We now plan to combine regular weather forecasts, which predict when and where thunderclouds will form, with solar magnetic field predictions. This means a reliable lightning forecast could now be a genuine possibility."

Source:  Institute of Physics

Invisible shield found thousands of miles above Earth blocks 'killer electrons'

Scientists have discovered an invisible shield roughly 7,200 miles above Earth.
Credit: Andy Kale, University of Alberta
A team led by the University of Colorado Boulder has discovered an invisible shield some 7,200 miles above Earth that blocks so-called "killer electrons," which whip around the planet at near-light speed and have been known to threaten astronauts, fry satellites and degrade space systems during intense solar storms.

The barrier to the particle motion was discovered in the Van Allen radiation belts, two doughnut-shaped rings above Earth that are filled with high-energy electrons and protons, said Distinguished Professor Daniel Baker, director of CU-Boulder's Laboratory for Atmospheric and Space Physics (LASP). Held in place by Earth's magnetic field, the Van Allen radiation belts periodically swell and shrink in response to incoming energy disturbances from the sun.

As the first significant discovery of the space age, the Van Allen radiation belts were detected in 1958 by Professor James Van Allen and his team at the University of Iowa and were found to be composed of an inner and outer belt extending up to 25,000 miles above Earth's surface. In 2013, Baker -- who received his doctorate under Van Allen -- led a team that used the twin Van Allen Probes launched by NASA in 2012 to discover a third, transient "storage ring" between the inner and outer Van Allen radiation belts that seems to come and go with the intensity of space weather.

The latest mystery revolves around an "extremely sharp" boundary at the inner edge of the outer belt at roughly 7,200 miles in altitude that appears to block the ultrafast electrons from breeching the shield and moving deeper towards Earth's atmosphere.

"It's almost like theses electrons are running into a glass wall in space," said Baker, the study's lead author. "Somewhat like the shields created by force fields on Star Trek that were used to repel alien weapons, we are seeing an invisible shield blocking these electrons. It's an extremely puzzling phenomenon."

A paper on the subject was published in the Nov. 27 issue of Nature.
The team originally thought the highly charged electrons, which are looping around Earth at more than 100,000 miles per second, would slowly drift downward into the upper atmosphere and gradually be wiped out by interactions with air molecules. But the impenetrable barrier seen by the twin Van Allen belt spacecraft stops the electrons before they get that far, said Baker.
The group looked at a number of scenarios that could create and maintain such a barrier. The team wondered if it might have to do with Earth's magnetic field lines, which trap and control protons and electrons, bouncing them between Earth's poles like beads on a string. 

The also looked at whether radio signals from human transmitters on Earth could be scattering the charged electrons at the barrier, preventing their downward motion. Neither explanation held scientific water, Baker said.

"Nature abhors strong gradients and generally finds ways to smooth them out, so we would expect some of the relativistic electrons to move inward and some outward," said Baker. "It's not obvious how the slow, gradual processes that should be involved in motion of these particles can conspire to create such a sharp, persistent boundary at this location in space."
Another scenario is that the giant cloud of cold, electrically charged gas called the plasmasphere, which begins about 600 miles above Earth and stretches thousands of miles into the outer Van Allen belt, is scattering the electrons at the boundary with low frequency, electromagnetic waves that create a plasmapheric "hiss," said Baker. The hiss sounds like white noise when played over a speaker, he said.

While Baker said plasmaspheric hiss may play a role in the puzzling space barrier, he believes there is more to the story. "I think the key here is to keep observing the region in exquisite detail, which we can do because of the powerful instruments on the Van Allen probes. If the sun really blasts Earth's magnetosphere with a coronal mass ejection (CME), I suspect it will breach the shield for a period of time," said Baker, also a faculty member in the astrophysical and planetary sciences department.

"It's like looking at the phenomenon with new eyes, with a new set of instrumentation, which give us the detail to say, 'Yes, there is this hard, fast boundary,'" said John Foster, associate director of MIT's Haystack Observatory and a study co-author.

 
Support : Creating Website | Johny Template | Mas Template
Copyright © 2011. The planet wall - All Rights Reserved
Template Created by Easy Blogging Published by Mas Template
Proudly powered by Blogger