Latest Post
Showing posts with label STROMS. Show all posts

NOAA’s investments in weather models and partnerships paying off

Written By Unknown on Tuesday, February 3, 2015 | 2:24 AM

Early improvements effective in forecasting recent Nor’easter; future forecast model upgrades planned
As the Northeast digs out from this week’s blizzard, a new NOAA-led effort to improve the forecasting of such high impact weather events is reaching an important early benchmark. One of the first major improvements - upgrading the resolution of three global forecast models -- has already shown its effectiveness. One of these models, the newly upgraded Global Forecast System (GFS) model, provided one of the most precise forecasts of the track, intensity, precipitation, and distribution of the Nor’easter. The other research models provided important forecast information, as well.

“The Global Forecast System did remarkably well in the recent Nor’easter,” said Louis Uccellini, director of NOAA’s National Weather Service. “This is due to the recent improvements we’ve made to the GFS, including higher resolution, improved physics, and better access to new data. With the help of scientists at NOAA Research, we’re making improvements to all our models, and upgrading supercomputers to improve our ability to translate data into actionable information, and to produce more timely, accurate and reliable forecasts.”

By the end of January, the $13 million project called the High Impact Weather Prediction Project (HIWPP), funded by Congress in the wake of Hurricane Sandy, will have improved the resolution on the global forecast model operated by NOAA Research Earth System Research Laboratory and the model operated by the U.S. Navy.
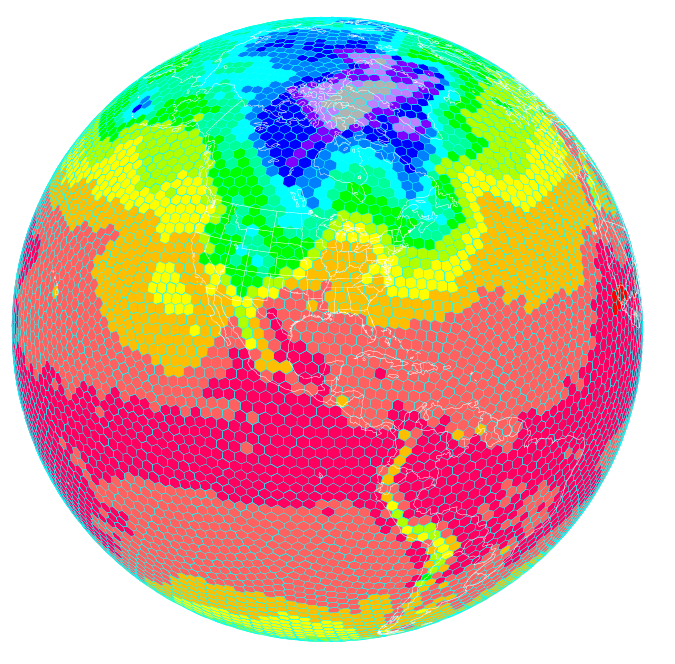
Improving global models
Scientists at NOAA’s Earth System Research Laboratory are running a high resolution global forecast model called the FIM, or Flow following finite volume Icoschedral Model. As depicted here, the FIM uses a unique grid that allows for a more uniform representation of the Earth. Higher resolution models are helping improve severe weather prediction. (NOAA)

In addition, NOAA researchers have written and installed programs to enable these three global models to work together effectively, which provides greater accuracy and confidence in forecasts. The third improvement is a plan to actively involve the broader weather forecasting community, including other public, academic and private sector scientists, in the evaluation of how these models work together to refine and improve forecasts.

“We are always looking for ways to improve the reliability and accuracy of our forecasts and models,” said John Cortinas, director of NOAA’s Office of Weather and Air Quality, who is overseeing HIWPP, which involves researchers from NOAA’s Oceanic and Atmospheric Research, NOAA’s National Weather Service, cooperative institutes, other government and academic partners.

“The goal of the project is to develop the next generation of weather forecast models that will eventually extend our ability to skillfully forecast high-impact weather out to several weeks and beyond,” Cortinas said. “By extending lead time for forecasts on storms like the one we’ve just experienced, cities and towns can better plan for these events, potentially saving lives and helping protect valuable land, homes and businesses. Businesses and industry can better plan everything from shipping to safe routing of air traffic to energy consumption. For ordinary citizens, it will be easier to plan an event or a trip.”

Over the last decades, weather forecasts have improved steadily so that we now have accurate forecasts out to five days, with reasonable accuracy to seven days. “We’ve gained about a day a decade in accuracy,” said Timothy Schneider, a research meteorologist at NOAA’s Earth System Research Laboratory, who is working to improve global forecast models. “Gaining a day of accuracy involves a combination of improving the science, adding computer power and increasing the necessary observations. With this project, we’re trying to accelerate this progress to make quicker gains.”

Global weather data key to improved local forecasts

“We know we can get better weather forecasts by improving the resolution of global forecast models so they depict weather in finer and finer detail,” explained Schneider. The resolution of NOAA’s two global forecast models has improved from grids that are 24 kilometers, to ones that are about 13 kilometers.  “The finer you chop up the picture, the more you can see of what is happening inside a particular storm. This helps us make better forecasts.”

 “If we’re going to predict weather out beyond seven and 10 days, we need even better global weather forecast models that show us what’s occurring on the other side of the Earth,” added Schneider. “Weather patterns on one side of the globe travel around the Earth and evolve. Storms born in the western Pacific follow air patterns that can create major winter storms on the West Coast, and weather patterns off the coast of Africa can spawn hurricanes in the U.S.”

Source: NOAA

Building a Better Weather Forecast? SMAP May Help

Written By Unknown on Saturday, January 31, 2015 | 5:34 AM

SMAP's soil moisture measurements will help with forecasts of precipitation and temperature. Image credit: UCAR
If you were trying to forecast tomorrow's weather, you would probably look up at the sky rather than down at the ground. But if you live in the U.S. Midwest or someplace with a similar climate, one key to a better weather forecast may lie beneath your feet.

Precipitation and temperature are part of every weather forecast. Precipitation comes from clouds, clouds are formed of airborne water vapor, and vapor comes from evaporating soil moisture -- so soil moisture governs precipitation. Evaporating soil moisture also makes air cooler, so it affects temperature. In certain kinds of climate, scientists believe, soil moisture is so influential that better observations of it might improve weather forecasts. These climates are transitional: not too humid and not too dry. For example, the agriculturally productive states of the U.S. Midwest fall into that category.

"Better soil moisture observations lead to better land-atmosphere interaction in weather forecasting models and ultimately to a better prediction of temperature and precipitation," said Michael Ek, leader of the Land Hydrology Team at the Environmental Monitoring Center of the National Oceanic and Atmospheric Administration (NOAA). "Weather models need good initial observations of the land surface, or you're starting from the wrong place."

Better soil moisture observations are just what the Soil Moisture Active Passive (SMAP) mission will provide. Scheduled for launch on Jan. 29, SMAP will collect the most accurate and highest-resolution soil moisture measurements ever made from a satellite SMAP will cover the entire globe in two to three days. Ek is a member of one of five groups in SMAP's Early Adopter program that have been working for several years on the question of how best to incorporate the new data into national weather forecasting models.

Forecasts will not improve, however, the moment SMAP starts collecting data. U.S. Department of Agriculture research scientist Wade Crow, a member of SMAP's science team, explained that, since closely spaced global soil moisture measurements have never existed before, the mathematical models used in weather forecasting are not configured to include them directly. Getting the best use out of the new observations has been a subject of active research for several years and will require some significant changes in how soil moisture data are assimilated into the models.

Data assimilation is necessary because weather forecasting models all drift a bit, like cars. If you're driving on a perfectly straight road, you still need to keep a hand on the steering wheel or you'll run off the edge sooner or later. Data assimilation in a model serves the same purpose as the slight movements of your hands that keep your car on course.

Drift is not a fatal flaw for a weather forecasting model any more than it is for a car. It is simply a sign that the Earth system is too vast and complicated to model perfectly with the resources available today. To steer forecasts toward greater realism, models ingest, or assimilate, real-world data and use them in sophisticated mathematical techniques. Each time updated observations become available, they are assimilated to improve the starting point for the next forecast.

Closely spaced and highly accurate global measurements are an important part of the process. For soil moisture, however, current observations are not on a fine enough scale to meet the needs of weather forecasting models directly. "Modelers compensate for the lack of direct observations of soil moisture by using more indirect measures, such as estimating it from observations of temperature and precipitation," Crow explained. "As a consequence, modeled soil moisture tends to diverge from reality. SMAP will be directly observing the state that they want, so they won't have to back it out from proxy measurements."

JPL scientist Eni Njoku is working with researchers at another forecasting center, the European Centre for Medium-Range Weather Forecasts (ECMWF) in Reading, England. Njoku said, "SMAP will provide benefits of higher soil moisture accuracy and spatial resolution than have previously been available from satellites. This could lead potentially to improved regional and global weather forecasts by ECMWF." Environment Canada, the branch of the Canadian government responsible for weather forecasting in that nation, is also working on assimilating SMAP data into its models.

"The numerical weather prediction centers are adapting to the new availability of soil moisture information and thinking of ways they can exploit it," Crow summarized. "It will be really exciting to see what they find."

SMAP is managed for NASA's Science Mission Directorate in Washington by the agency's Jet Propulsion Laboratory in Pasadena, California, with instrument hardware and science contributions made by NASA's Goddard Space Flight Center in Greenbelt, Maryland. JPL is responsible for project management, system engineering, radar instrumentation, mission operations and the ground data system. Goddard is responsible for the radiometer instrument. Both centers collaborate on science data processing and delivery to the Alaska Satellite Facility, in Fairbanks, and the National Snow and Ice Data Center, at the University of Colorado in Boulder, for public distribution and archiving. NASA's Launch Services Program at the agency's Kennedy Space Center in Florida is responsible for launch management. JPL is managed for NASA by the California Institute of Technology in Pasadena.

Source: Nasa

The NASA and NOAA's Nighttime and Daytime Views of the Blizzard of 2015

Written By Unknown on Tuesday, January 27, 2015 | 4:50 PM

On January 27, 2015 at 17:35 UTC (12:35 p.m. EST) NOAA's Geostationary Operational Environmental or GOES- East satellite captured an image of the nor'easter over New England. Credit: NASA/NOAA GOES Project
NASA and NOAA have provided night-time and daytime views of the Blizzard of 2015 from the Suomi NPP and the GOES-East satellites.

A combination of the day-night band and high resolution infrared imagery from the NASA-NOAA's Suomi NPP satellite showed the historic blizzard near peak intensity as it moves over the New York through Boston Metropolitan areas at 06:45Z (1:45 a.m. EST) on January 27, 2015. The nighttime lights of the region were blurred by the high cloud tops associated with the most intense parts of the storm. 

The center of the low pressure center was about 85 miles southeast of Nantucket, Massachusetts at 9:00 a.m. EST and had an estimated pressure of 975 millibars. The center of the storm was moving in a north-northeasterly direction.

At 10 a.m. EST, the National Weather Service noted "the powerful nor'easter that brought moderate to heavy snowfall and blizzard conditions to the Northeast on Monday will continue to affect the region on Tuesday, with heavy snow and blizzard conditions expected from eastern Long Island to Maine as the system slowly moves to the northeast. Snow and strong winds will being tapering off from south to north Tuesday night into Wednesday morning."

Later on January 27, 2015 at 17:35 UTC (12:35 p.m. EST) NOAA's Geostationary Operational Environmental or GOES-East satellite captured an image of the nor'easter over New England. The image was created by the NASA/NOAA GOES Project and showed the clouds associated with the nor'easter blanketing New England.  An occluded front extended north and eastward out of the low pressure area's center out into the Atlantic Ocean.

GOES satellites provide the kind of continuous monitoring necessary for intensive data analysis. Geostationary describes an orbit in which a satellite is always in the same position with respect to the rotating Earth. This allows GOES to hover continuously over one position on Earth's surface, appearing stationary. As a result, GOES provide a constant vigil for the atmospheric "triggers" for severe weather conditions such as tornadoes, flash floods, hail storms and hurricanes.

Source: Nasa

Tornado strength, frequency, linked to climate change

Written By Unknown on Sunday, December 21, 2014 | 9:29 PM

Tornado (stock image). New research by a Florida State University geography professor shows that climate change may be playing a key role in the strength and frequency of tornadoes hitting the United States. Credit: © fotola70 / Fotolia
New research by a Florida State University geography professor shows that climate change may be playing a key role in the strength and frequency of tornadoes hitting the United States.

Published Wednesday in the journal Climate Dynamics, Professor James Elsner writes that though tornadoes are forming fewer days per year, they are forming at a greater density and strength than ever before. So, for example, instead of one or two forming on a given day in an area, there might be three or four occurring.

"We may be less threatened by tornadoes on a day-to-day basis, but when they do come, they come like there's no tomorrow," Elsner said.
Elsner, an expert in climate and weather trends, said in the past, many researchers dismissed the impact of climate change on tornadoes because there was no distinct pattern in the number of tornado days per year. In 1971, there were 187 tornado days, but in 2013 there were only 79 days with tornadoes.
But a deeper dive into the data showed more severity in the types of storms and that more were happening on a given day than in previous years.

"I think it's important for forecasters and the public to know this," Elsner said. "It's a matter of making sure the public is aware that if there is a higher risk of a storm, there may actually be multiple storms in a day."

The United States experiences more tornadoes than any other country, and despite advances in technology and warning systems, they still remain a hazard to residents in storm-prone areas. The 2011 tornado season, for example, had nearly 1,700 storms and killed more than 550 people.

So far, in 2014, there have been 189 storms with a death toll of 43, according to the NOAA/National Weather Service Storm Prediction Center.

One bright spot of news in the research, Elsner added, was that the geographic areas impacted most regularly by tornadoes do not appear to be growing.

Elsner was joined on the paper by independent researcher Thomas H. Jagger, formerly a research associate at Florida State University, and meteorologist Svetoslava Elsner.

Source: Florida State University

Intensity of hurricanes: New study helps improve predictions of storm intensity

Rough sea with big waves (stock image). "The air-water interface -- whether it had significant waves or significant spray -- is a big factor in storm intensity," said Alex Soloviev, Ph.D., a professor at Nova Southeastern University's Oceanographic Center. "Hurricanes gain heat energy through the interface and they lose mechanical energy at the interface." Credit: © mimadeo / Fotolia
They are something we take very seriously in Florida -- hurricanes. The names roll off the tongue like a list of villains -- Andrew, Charlie, Frances and Wilma.

In the past 25 years or so, experts have gradually been improving prediction of the course a storm may take. This is thanks to tremendous advancements in computer and satellite technology. While we still have the "cone of uncertainty" we've become familiar with watching television weather reports, today's models are more accurate than they used to be.

The one area, however, where there is still much more to be researched and learned is in predicting just how intense a storm may be. While hurricane hunter aircraft can help determine wind speed, velocity, water temperature and other data, the fact is we often don't know why or how a storm gets stronger or weaker. There has been virtually no progress in hurricane intensity forecasting during the last quarter century.

But, thanks to new research being conducted, all that's about to change.

"The air-water interface -- whether it had significant waves or significant spray -- is a big factor in storm intensity," said Alex Soloviev, Ph.D., a professor at Nova Southeastern University's Oceanographic Center. "Hurricanes gain heat energy through the interface and they lose mechanical energy at the interface."

Soloviev is also an Adjunct Professor at the University of Miami Rosenstiel School of Marine and Atmospheric Science (UM RSMAS) and a Fellow at the Cooperative Institute for Marine and Atmospheric Studies (CIMAS.) He and his fellow researchers used a computational fluid dynamics model to simulate microstructure of the air-sea interface under hurricane force winds. In order to verify these computer-generated results, the group conducted experiments at the UM's Rosenstiel School Air-Sea Interaction Salt Water Tank (ASIST) where they simulated wind speed and ocean surface conditions found during hurricanes.
The study "The Air-Sea Interface and Surface Stress Under Tropical Cyclones" was published in the June 16, 2014 issue of the journal Nature Scientific Reports. Soloviev was the lead author of this study, which was conducted by a multi-institutional team including Roger Lukas (University of Hawaii), Mark Donelan and Brian Haus (UM RSMAS), and Isaac Ginis (University of Rhode Island.)
The researchers were surprised at what they found. Under hurricane force wind, the air-water interface was producing projectiles fragmenting into sub millimeter scale water droplets. This process is known from some engineering applications, including rocket science, as the Kelvin-Helmholtz (KH) instability. This new study then looked at how changes in microphysics of the air-sea interface can make a storm grow or weaken in intensity. With wind speed exceeding a Category 1 threshold, the ocean surface unexpectedly became more "slippery."

When the wind exceeded Category 3 hurricane force, the "slippery" effect started gradually disappearing and was completely gone at Category 5. The conclusion was that some hurricanes might rapidly intensify to Category 3 and then stay in a "comfortable" zone around Category 3 status. This finding is consistent with the global best-track tropical cyclone statistics on maximum intensity for 1982-2009. So far, these early results showed that physical conditions where the air and the ocean interact must be a vital part of any successful hurricane forecasting model and would help explain, and predict, how a storm might intensify as it moves through across the water based on the physical stress at the ocean's surface.

This work has been supported by the NOPP project "Advanced coupled atmosphere-wave-ocean modeling for improving tropical cyclone prediction models" (PIs: Isaac Ginis, URI and Shuyi Chen, UM) and by the Gulf of Mexico Research Initiative (GoMRI) Consortium for Advanced Research on the Transport of Hydrocarbons in the Environment -- CARTHE (PI: Tamay ร–zgรถkmen, UM). GoMRI is a 10-year, $500 million independent research program established by an agreement between BP and the Gulf of Mexico Alliance.

The plan is for the team to continue their research and experiments at UM's Alfred C. 

Glassell, Jr. SUSTAIN facility, which has recently been designed by one of the Nature article co-authors, Brian Haus (UM). It's the unique lab facility where they can recreate the conditions found in a Category 5 storm.

"We've got more work to do, but this is a great first step," Soloviev said. "But remember, no matter how good we get in predicting a storm's intensity, people in the path need to prepare accordingly regardless of what Category it is -- that's most important."

Source: Nova Southeastern University

U.S. releases enhanced shuttle land elevation data

Shaded relief images of deeply eroded volcanic terrain in northeast Tanzania demonstrate the improved nature of the highest-resolution SRTM data now being released. The image at left has data samples spaced every 90 meters (295 feet); the image at right has samples spaced every 30 meters (98 feet). Credit: NASA/JPL-Caltech/National Geospatial Intelligence Agency
High-resolution topographic data generated from NASA's Shuttle Radar Topography Mission (SRTM) in 2000, previously only available for the United States, will be released globally over the next year, the White House announced today. The announcement was made at the United Nations Heads of State Climate Summit in New York.

This initial public release of topographic data for Africa will help empower local authorities to better plan for the impacts of severe environmental changes such as drought, glacial retreat, inland flooding, landslides and coastal storm surges. Datasets covering the remaining continents will be made available within one year, with the next release of data focusing on Latin America and the Caribbean.

Lower-resolution SRTM topographic data having 90-meter (295-foot) pixels were released publicly in 2003 for many parts of the world, providing a global standard for many applications. The new data increase the detail to 30-meter (98-foot) pixel spacing, now revealing the full resolution of the world's landforms as originally measured by SRTM.
"The public availability of enhanced global SRTM topographic data will greatly benefit international efforts to better understand natural processes that shape our planet, prepare for and respond to natural hazards, and anticipate and prepare for the impacts of global change," said NASA Chief Scientist Ellen Stofan. "NASA is proud to have played a critical role in creating these data that will benefit society through open data sharing."
SRTM was a joint project of NASA, the German and Italian space agencies, and the National Geospatial-Intelligence Agency. It was managed by NASA's Jet Propulsion Laboratory, Pasadena, California, for NASA's Science Mission Directorate, Washington, D.C. The newly released 30-meter topographic data products will be publicly distributed by the U.S.  
Geological Survey (USGS) along with the 90-meter data. These data are being made available via a user-friendly interface on USGS's Earth Explorer website.
SRTM flew aboard the Space Shuttle Endeavour in February 2000, mapping Earth's topography between 56 degrees south and 60 degrees north of the equator. During the 11-day mission, SRTM used an imaging radar to map the surface of Earth numerous times from different perspectives. The combination of these radar data were processed at JPL to produce a global topographic map created by bouncing radar signals off Earth's surface and back to the shuttle.
Topographic data benefit a wide variety of activities, from aviation safety to civil engineering projects. Topography also strongly influences many natural processes, such as the distribution of plant communities and the associated animals that depend upon them, weather and rainfall patterns, and the flow and storage of surface water. The data aid in better understanding, predicting and responding to flooding from severe storms and the threats of coastal inundation associated with storm surge, tsunamis and sea-level rise.

Multiple training workshops on SRTM data are planned for users in Africa. The SERVIR program, a joint venture by NASA and the U.S. Agency for International Development, is planning workshops in Eastern and Southern Africa with the Regional Centre for Mapping of Resources for Development, and in West Africa with key environmental organizations. 

The Secure World Foundation is partnering with NASA, USGS and other members of the international Committee on Earth Observation Satellites to offer online training and regional workshops to further enable users to take advantage of these data resources. JPL is a division of the California Institute of Technology in Pasadena.

Source: NASA/Jet Propulsion Laboratory

Lightning expected to increase by 50 percent with global warming

Today's climate models predict a 50 percent increase in lightning strikes across the United States during this century as a result of warming temperatures associated with climate change. Credit: © Sondem / Fotolia
Today's climate models predict a 50 percent increase in lightning strikes across the United States during this century as a result of warming temperatures associated with climate change.

Reporting in the Nov. 14 issue of the journal Science, University of California, Berkeley, climate scientist David Romps and his colleagues look at predictions of precipitation and cloud buoyancy in 11 different climate models and conclude that their combined effect will generate more frequent electrical discharges to the ground.

"With warming, thunderstorms become more explosive," said Romps, an assistant professor of earth and planetary science and a faculty scientist at Lawrence Berkeley National Laboratory. "This has to do with water vapor, which is the fuel for explosive deep convection in the atmosphere. Warming causes there to be more water vapor in the atmosphere, and if you have more fuel lying around, when you get ignition, it can go big time."

More lightning strikes mean more human injuries; estimates of people struck each year range from the hundreds to nearly a thousand, with scores of deaths. But another significant impact of increased lightning strikes would be more wildfires, since half of all fires -- and often the hardest to fight -- are ignited by lightning, Romps said. More lightning also would likely generate more nitrogen oxides in the atmosphere, which exert a strong control on atmospheric chemistry.

While some studies have shown changes in lightning associated with seasonal or year-to-year variations in temperature, there have been no reliable analyses to indicate what the future may hold. Romps and graduate student Jacob Seeley hypothesized that two atmospheric properties -- precipitation and cloud buoyancy -- together might be a predictor of lightning, and looked at observations during 2011 to see if there was a correlation.

"Lightning is caused by charge separation within clouds, and to maximize charge separation, you have to loft more water vapor and heavy ice particles into the atmosphere," he said. "We already know that the faster the updrafts, the more lightning, and the more precipitation, the more lightning."

Precipitation -- the total amount of water hitting the ground in the form of rain, snow, hail or other forms -- is basically a measure of how convective the atmosphere is, he said, and convection generates lightning. The ascent speeds of those convective clouds are determined by a factor called CAPE -- convective available potential energy -- which is measured by balloon-borne instruments, called radiosondes, released around the U.S. twice a day.

"CAPE is a measure of how potentially explosive the atmosphere is, that is, how buoyant a parcel of air would be if you got it convecting, if you got it to punch through overlying air into the free troposphere," Romps said. "We hypothesized that the product of precipitation and CAPE would predict lightning."

Using U.S. Weather Service data on precipitation, radiosonde measurements of CAPE and lightning- strike counts from the National Lightning Detection Network at the University of Albany, State University of New York (UAlbany), they concluded that 77 percent of the variations in lightning strikes could be predicted from knowing just these two parameters.

'Blown away'

"We were blown away by how incredibly well that worked to predict lightning strikes," he said.

They then looked at 11 different climate models that predict precipitation and CAPE through this century and are archived in the most recent Coupled Model Intercomparison Project (CMIP5). CMIP was established as a resource for climate modelers, providing a standard protocol for studying the output of coupled atmosphere-ocean general circulation models so that these models can be compared and validated.

"With CMIP5, we now have for the first time the CAPE and precipitation data to calculate these time series," Romps said.
On average, the models predicted an 11 percent increase in CAPE in the U.S. per degree Celsius rise in global average temperature by the end of the 21st century. Because the models predict little average precipitation increase nationwide over this period, the product of CAPE and precipitation gives about a 12 percent rise in cloud-to-ground lightning strikes per degree in the contiguous U.S., or a roughly 50 percent increase by 2100 if Earth sees the expected 4-degree Celsius increase (7 degrees Fahrenheit) in temperature. This assumes carbon dioxide emissions keep rising consistent with business as usual.
Exactly why CAPE increases as the climate warms is still an area of active research, Romps said, though it is clear that it has to do with the fundamental physics of water. Warm air typically contains more water vapor than cold air; in fact, the amount of water vapor that air can "hold" increases exponentially with temperature. Since water vapor is the fuel for thunderstorms, lightning rates can depend very sensitively on temperature.

In the future, Romps plans to look at the distribution of lightning-strike increases around the U.S. and also explore what lightning data can tell climatologists about atmospheric convection.

Romps' co-authors are Jacob Seeley, also of the Department of Earth and Planetary Science at UC Berkeley, and David Vollaro and John Molinari of the Department of Atmospheric and Environmental Sciences at UAlbany.

The work was supported by the U.S. Department of Energy's Office of Advanced Scientific Computing Research and Office of Biological and Environmental Research, and the National Science Foundation.

WATCH VIDEO


Source: University of California - Berkeley

Birds Sensed severe storms and fled before tornado outbreak

Written By Unknown on Friday, December 19, 2014 | 11:38 PM

This golden-winged warbler spends the breeding season in the Cumberland Mountains of Tennessee. Credit: Henry Streby and Gunnar Kramer
Golden-winged warblers apparently knew in advance that a storm that would spawn 84 confirmed tornadoes and kill at least 35 people last spring was coming, according to a report in the Cell Press journal Current Biology on December 18. The birds left the scene well before devastating supercell storms blew in.

The discovery was made quite by accident while researchers were testing whether the warblers, which weigh "less than two nickels," could carry geolocators on their backs. It turns out they can, and much more. With a big storm brewing, the birds took off from their breeding ground in the Cumberland Mountains of eastern Tennessee, where they had only just arrived, for an unplanned migratory event. All told, the warblers travelled 1,500 kilometers in 5 days to avoid the historic tornado-producing storms.

"The most curious finding is that the birds left long before the storm arrived," says Henry Streby of the University of California, Berkeley. "At the same time that meteorologists on The Weather Channel were telling us this storm was headed in our direction, the birds were apparently already packing their bags and evacuating the area."

The birds fled from their breeding territories more than 24 hours before the arrival of the storm, Streby and his colleagues report. The researchers suspect that the birds did it by listening to infrasound associated with the severe weather, at a level well below the range of human hearing.

"Meteorologists and physicists have known for decades that tornadic storms make very strong infrasound that can travel thousands of kilometers from the storm," Streby explains. While the birds might pick up on some other cue, he adds, the infrasound from severe storms travels at exactly the same frequency the birds are most sensitive to hearing.

The findings show that birds that follow annual migratory routes can also take off on unplanned trips at other times of the year when conditions require it. That's probably good news for birds, as climate change is expected to produce storms that are both stronger and more frequent. But there surely must be a downside as well, the researchers say.

"Our observation suggests [that] birds aren't just going to sit there and take it with regards to climate change, and maybe they will fare better than some have predicted," Streby says. "On the other hand, this behavior presumably costs the birds some serious energy and time they should be spending on reproducing." The birds' energy-draining journey is just one more pressure human activities are putting on migratory songbirds.

In the coming year, Streby's team will deploy hundreds of geolocators on the golden-winged warblers and related species across their entire breeding range to find out where they spend the winter and how they get there and back.

"I can't say I'm hoping for another severe tornado outbreak," Streby says, "but I am eager to see what unpredictable things happen this time."

Source: Cell Press

Easy measurement of the effect of fine dust

Written By Unknown on Thursday, December 18, 2014 | 6:05 AM

The Karlsruhe Exposure System is compact and can measure fine dust concentrations directly at the location of pollution. Credit: VITROCELL Systems GmbH
Fine dusts from industry, traffic, and households are omnipresent. Still, they are difficult to capture by reliable medical measurements. KIT researchers have now developed an exposure system, by means of which biological cells are exposed to fine dust-loaded air flows in an exact and reproducible manner. Using this system, it is possible to collect data on the adverse impact of fine dusts of variable sources in a rapid and inexpensive manner and without animal experiments being needed. In cooperation with the industry partner Vitrocell, a marketable product has been developed.

"Fine dusts may be carbon black from diesel engines, sea salt on the coast, natural dusts, or intermediate products of chemical industry," Dr. Hanns-Rudolf Paur and Sonja Mรผlhopt of Karlsruhe Institute of Technology explain. All dust grains smaller than 10 ยตm, i.e. one hundredth of a millimeter, are considered to be fine dust irrespective of their chemical composition. Dust particles smaller than 10 ยตm easily pass the upper respiratory tract of man. "They deposit in the pulmonary alveoli and may damage the lungs due to their chemical or physical properties."

To study the effects in detail, lung cells and fine dust have to be brought together in a realistic environment. Ultimately, the processes taking place in the human body from the nose to the lungs have to be reproduced. For this purpose, the air containing the fine dust is heated up to body temperature by the Karlsruhe Exposure System. The air flow is provided with about 85% humidity and reduced to the air flow rate of the lungs. For a long-term measurement series, these conditions have to be maintained exactly and reproducibly. Finally, the particle flow passes lung cell cultures cultivated with nutrient medium. 

Depending on the type of fine dust, these cultures subsequently show symptoms of inflammation, oxidation stress, or membrane damage. In parallel, the deposited particle dose is recorded by means of a precision balance.

The new Exposure System is much closer to reality than previous methods that collected fine dust from air or exhaust gas and stirred it into the nutrient liquid. At the same time, the Exposure System works more rapidly for many applications and is cheaper than a study based on animal experiments. Thanks to its compactness, the Karlsruhe Exposure System can also be used for measurements at the place of fine dust development or pollution. "The limitations of conventional methods were overcome by the close, interdisciplinary cooperation of biologists and process engineers at KIT," the Head of the project, Sonja Mรผlhopt, says. "With the Karlsruhe Exposure System, we now have a technology that will improve the protection of the environment and mankind."

"Research at KIT was the basis of a process with a high industry potential," Tobias Krebs of the company Vitrocell Systems (Waldkirch) says. "Together, we now plan to commercialize this product." The impact of fine dusts plays an important role in fundamental research as well as in many areas of application. According to the EU Directive on Chemicals REACH, chemical industry is obliged to classify its products in various hazard categories. 
Manufacturers of lung medicine, such as asthma sprays, are now enabled to test new substances in a close-to-reality manner. New and old biomass fuels may also be relevant fine dust sources.

Hurricane-forecast satellites will keep close eyes on the tropics

Written By Unknown on Wednesday, December 17, 2014 | 9:45 PM

A set of eight satellites -- each about the size of a microwave oven -- will launch in 2016 and provide scientists unprecedented information about the formation and evolution of hurricanes. Credit: Aaron Ridley
 A set of eight hurricane-forecast satellites being developed at the University of Michigan is expected to give deep insights into how and where storms suddenly intensify--a little-understood process that's becoming more crucial to figure out as the climate changes, U-M researchers say.

The Cyclone Global Navigation Satellite System is scheduled to launch in fall 2016. At the American Geophysical Union Meeting in San Francisco this week, U-M researchers released estimates of how significantly CYGNSS could improve wind speed and storm intensity forecasts.

CYGNSS--said like the swan constellation--is a $173-million NASA mission that U-M is leading with Texas-based Southwest Research Institute. Each of its eight observatories is about the size of a microwave oven. That's much smaller than a typical weather satellite, which is about the size of a van.

The artificial CYGNSS "constellation," as researchers refer to it, will orbit at tropical, hurricane-belt latitudes. Its coverage will stretch from the 38th parallel north near Delaware's latitude to its counterpart in the south just below Buenos Aires.

Because of their arrangement and number, the observatories will be able to measure the same spot on the globe much more often than the weather satellites flying today can. CYGNSS's revisit time will average between four and six hours, and at times, it can be as fast as 12 minutes.

Conventional weather satellites only cross over the same point once or twice a day. Meteorologists can use ground-based Doppler radar to help them make predictions about storms near land, but hurricanes, which form over the open ocean, present a tougher problem.

"The rapid refresh CYGNSS will offer is a key element of how we'll be able to improve hurricane forecasts," said CYGNSS lead investigator Christopher Ruf, director of the U-M Space Physics Research Lab and professor of atmospheric, oceanic and space sciences.
"CYGNSS gets us the ability to measure things that change fast, like extreme weather. Those are the hardest systems to measure with today's satellites. And because the world is warmer and there's more energy to feed storm systems, there's more likelihood of extreme weather."
Through simulations, the researchers quantified the improvement CYGNSS could have on storm intensity predictions. They found that for a wind speed forecast that is off by 33 knots, or 38 miles per hour--the average error with current capabilities--CYGNSS could reduce that by 9 knots, or about 10 mph.

Considering that the categories of hurricane strength ratchet up, on average, every 20 mph, the accuracy boost is "a very significant number," Ruf said.

"I'd describe the feeling about it as guarded excitement," he said. "It's preliminary and it's all based on models. People will be really excited when we get up there and it works."
The numbers could also improve as scientists update weather prediction tools to better use the new kind of information that CYGNSS will provide.

For people who live in common hurricane or typhoon paths, closer wind speed predictions could translate into more accurate estimates of the storm surge at landfall, Ruf said. That's the main way these systems harm people and property.

"The whole ocean gets higher because the wind pushes the water. That's really hard to forecast now and it's an area we hope to make big improvements in," Ruf said.
Researchers expect the satellite system to give them new insights into storm processes. Hurricanes evolve slowly at first, but then they reach a tipping point, says Aaron Ridley, a professor of atmospheric, oceanic and space sciences.

"The hurricane could be meandering across the Atlantic Ocean and then something happens." Ridley said. "It kicks up a notch and people aren't exactly sure why. A lot of scientists would like to study this rapid intensification in more detail. With a normal mission, you might not be able to see it, but with CYGNSS, you have a better chance."
The satellites will operate in a fundamentally different way than their counterparts do. Rather than transmit a signal and read what reflects back, they'll measure how GPS signals from other satellites bounce off the ocean surface. Each of the eight CYGNSS nodes will measure signals from four of the 32 Global Positioning System satellites.

They'll also be able to take measurements through heavy rain--something other weather satellites are, surprisingly, not very good at.

Source: University of Michigan

Satellites measure increase of Sun's energy absorbed in the Arctic

The Arctic Ocean is absorbing more of the sun's energy in recent years as white, reflective sea ice melts and darker ocean waters are exposed. The increased darker surface area during the Arctic summer is responsible for a 5 percent increase in absorbed solar radiation since 2000.
Credit: NASA Goddard's Scientific Visualization Studio/Lori Perkins
NASA satellite instruments have observed a marked increase in solar radiation absorbed in the Arctic since the year 2000 -- a trend that aligns with the steady decrease in Arctic sea ice during the same period.

While sea ice is mostly white and reflects the sun's rays, ocean water is dark and absorbs the sun's energy at a higher rate. A decline in the region's albedo -- its reflectivity, in effect -- has been a key concern among scientists since the summer Arctic sea ice cover began shrinking in recent decades. As more of the sun's energy is absorbed by the climate system, it enhances ongoing warming in the region, which is more pronounced than anywhere else on the planet.

Since the year 2000, the rate of absorbed solar radiation in the Arctic in June, July and August has increased by five percent, said Norman Loeb, of NASA's Langley Research Center, Hampton, Virginia. The measurement is made by NASA's Clouds and the Earth's Radiant Energy System (CERES) instruments, which fly on multiple satellites.
While a five percent increase may not seem like much, consider that the rate globally has remained essentially flat during that same time. No other region on Earth shows a trend of potential long-term change.

When averaged over the entire Arctic Ocean, the increase in the rate of absorbed solar radiation is about 10 Watts per square meter. This is equivalent to an extra 10-watt light bulb shining continuously over every 10.76 square feet of Arctic Ocean for the entire summer.

Regionally, the increase is even greater, Loeb said. Areas such as the Beaufort Sea, which has experienced the some of the most pronounced decreases in sea-ice coverage, show a 50 watts per square meter increase in the rate of absorbed solar radiation.
"Advances in our understanding of Arctic climate change and the underlying processes that influence it will depend critically upon high quality observations like these from CERES," Loeb said.

As a region, the Arctic is showing more dramatic signs of climate change than any other spot on the planet. These include a warming of air temperatures at a rate two to three times greater than the rest of the planet and the loss of September sea ice extent at a rate of 13 percent per decade.

While these CERES measurements could ultimately become another of those signs of dramatic climate change, right now scientists say they have obtained the bare minimum of a data record needed to discern what's happening over the long term.
Getting data beyond 15 years will allow scientists to better assess if recent trend falls outside the realm of natural variability, said Jennifer Kay, an atmospheric scientist at the Cooperative Institute for Research and Environmental Science at the University of Colorado.

"We need long time series to detect climate change signals over the internal variability. For example, observed sea ice loss over the last 30 years cannot be explained by natural variability alone." Kay said. "Fifteen years is long, but climate is often defined as the average over 30 years -- so we are only half-way there with the CERES observations."
Kay and colleagues have also analyzed satellite observations of Arctic clouds during this same 15-year period. Kay's research shows summer cloud amounts and vertical structure are not being affected by summer sea ice loss. While surprising, the observations show that the bright sea ice surface is not automatically replaced by bright clouds. Indeed, sea ice loss, not clouds, explain the increases in absorbed solar radiation measured by CERES.
Increasing absorbed solar radiation is causing multiple changes in the sea ice cover, said Walt Meier, a sea ice scientist from NASA's Goddard Space Flight Center, Greenbelt, Maryland. Two of those changes include the timing of the beginning of the melt season each year and the loss of older, thicker sea ice.

The onset of the melt season in the high Arctic is now on average seven days earlier than it was in 1982, Meier said. Earlier melting can lead to increased solar radiation absorption. This is one step in a potential feedback cycle of warming leading to melting, melting leading to increased solar radiation absorption, and increased absorption leading to enhanced warming.

Since 2000, the Arctic has lost 1.4 million square kilometers (541,000 square miles) of older ice that is more than 3 meters thick, which during winter has essentially been replaced by ice that is less than 2 meters thick, according to data provided by Mark Tschudi at the University of Colorado. Once again, Meier said, this trend is a step in a feedback cycle.

"Having younger and thus thinner ice during winter makes the system more vulnerable to ice loss during the summer melt season," Meier said.

CERES instruments are currently flying on the Terra, Aqua and Suomi-NPP satellites. The Terra satellite launched Dec. 18, 1999, and CERES first started collecting Arctic data in 2000 so 2015 will mark 15 continuous years of CERES measurements over the Arctic.
The instruments include three radiometers -- one measuring solar radiation reflected by Earth (shortwave), one measuring thermal infrared radiation emitted by Earth (longwave), and one measuring all outgoing radiation, whether emitted or reflected.

Source:  NASA/Goddard Space Flight Center

NASA's Fermi Mission brings deeper focus to thunderstorm gamma rays

Written By Unknown on Tuesday, December 16, 2014 | 10:52 PM

New research merging Fermi data with information from ground-based radar and lightning networks shows that terrestrial gamma-ray flashes arise from an unexpected diversity of storms and may be more common than currently thought. Credit: NASA's Goddard Space Flight Center
Each day, thunderstorms around the world produce about a thousand quick bursts of gamma rays, some of the highest-energy light naturally found on Earth. By merging records of events seen by NASA's Fermi Gamma-ray Space Telescope with data from ground-based radar and lightning detectors, scientists have completed the most detailed analysis to date of the types of thunderstorms involved.

"Remarkably, we have found that any thunderstorm can produce gamma rays, even those that appear to be so weak a meteorologist wouldn't look twice at them," said Themis Chronis, who led the research at the University of Alabama in Huntsville (UAH).

The outbursts, called terrestrial gamma-ray flashes (TGFs), were discovered in 1992 by NASA's Compton Gamma-Ray Observatory, which operated until 2000. TGFs occur unpredictably and fleetingly, with durations less than a thousandth of a second, and remain poorly understood.
In late 2012, Fermi scientists employed new techniques that effectively upgraded the satellite's Gamma-ray Burst Monitor (GBM), making it 10 times more sensitive to TGFs and allowing it to record weak events that were overlooked before.

"As a result of our enhanced discovery rate, we were able to show that most TGFs also generate strong bursts of radio waves like those produced by lightning," said Michael Briggs, assistant director of the Center for Space Plasma and Aeronomic Research at UAH and a member of the GBM team.
Previously, TGF positions could be roughly estimated based on Fermi's location at the time of the event. The GBM can detect flashes within about 500 miles (800 kilometers), but this is too imprecise to definitively associate a TGF with a specific storm.

Ground-based lightning networks use radio data to pin down strike locations. The discovery of similar signals from TGFs meant that scientists could use the networks to determine which storms produce gamma-ray flashes, opening the door to a deeper understanding of the meteorology powering these extreme events.

Chronis, Briggs and their colleagues sifted through 2,279 TGFs detected by Fermi's GBM to derive a sample of nearly 900 events accurately located by the Total Lightning Network operated by Earth Networks in Germantown, Maryland, and the World Wide Lightning Location Network, a research collaboration run by the University of Washington in Seattle. These systems can pinpoint the location of lightning discharges -- and the corresponding signals from TGFs -- to within 6 miles (10 km) anywhere on the globe.

From this group, the team identified 24 TGFs that occurred within areas covered by Next Generation Weather Radar (NEXRAD) sites in Florida, Louisiana, Texas, Puerto Rico and Guam. For eight of these storms, the researchers obtained additional information about atmospheric conditions through sensor data collected by the Department of Atmospheric Science at the University of Wyoming in Laramie.

"All told, this study is our best look yet at TGF-producing storms, and it shows convincingly that storm intensity is not the key," said Chronis, who will present the findings Wed., Dec. 17, in an invited talk at the American Geophysical Union meeting in San Francisco. A paper describing the research has been submitted to the Bulletin of the American Meteorological Society.

Scientists suspect that TGFs arise from strong electric fields near the tops of thunderstorms. Updrafts and downdrafts within the storms force rain, snow and ice to collide and acquire electrical charge. Usually, positive charge accumulates in the upper part of the storm and negative charge accumulates below. When the storm's electrical field becomes so strong it breaks down the insulating properties of air, a lightning discharge occurs.

Under the right conditions, the upper part of an intracloud lightning bolt disrupts the storm's electric field in such a way that an avalanche of electrons surges upward at high speed. When these fast-moving electrons are deflected by air molecules, they emit gamma rays and create a TGF.
About 75 percent of lightning stays within the storm, and about 2,000 of these intracloud discharges occur for each TGF Fermi detects.

The new study confirms previous findings indicating that TGFs tend to occur near the highest parts of a thunderstorm, between about 7 and 9 miles (11 to 14 kilometers) high. "We suspect this isn't the full story," explained Briggs. "Lightning often occurs at lower altitudes and TGFs probably do too, but traveling the greater depth of air weakens the gamma rays so much the GBM can't detect them."
Based on current Fermi statistics, scientists estimate that some 1,100 TGFs occur each day, but the number may be much higher if low-altitude flashes are being missed.

While it is too early to draw conclusions, Chronis notes, there are a few hints that gamma-ray flashes may prefer storm areas where updrafts have weakened and the aging storm has become less organized. "Part of our ongoing research is to track these storms with NEXRAD radar to determine if we can relate TGFs to the thunderstorm life cycle," he said.

Video: https://www.youtube.com/watch?v=JgK4Ds_Sj6Q#t=66

Source: NASA/Goddard Space Flight Center

The Magnetic anomaly deep within Earth's crust reveals Africa in North America

Written By Unknown on Wednesday, October 29, 2014 | 2:27 AM

The repeated cycles of plate tectonics that have led to collision and assembly of large supercontinents and their breakup and formation of new ocean basins have produced continents that are collages of bits and pieces of other continents. Figuring out the origin and make-up of continental crust formed and modified by these tectonic events is vital to understanding Earth's geology and is important for many applied fields, such as oil, gas, and gold exploration.

In many cases, the rocks involved in these collision and pull-apart episodes are still buried deep beneath Earth's surface, so geologists must use geophysical measurements to study these features.
This new study by Elias Parker Jr. of the University of Georgia examines a prominent swath of lower-than-normal magnetism -- known as the Brunswick Magnetic Anomaly -- that stretches from Alabama through Georgia and off shore to the North Carolina coast.

The cause of this magnetic anomaly has been under some debate. Many geologists attribute the Brunswick Magnetic Anomaly to a belt of 200 million year old volcanic rocks that intruded around the time the Atlantic Ocean. In this case, the location of this magnetic anomaly would then mark the initial location where North America split from the rest of Pangea as that ancient supercontinent broke apart. Parker proposes a different source for this anomalous magnetic zone.

Drawing upon other studies that have demonstrated deeply buried metamorphic rocks can also have a coherent magnetic signal, Parker has analyzed the detailed characteristics of the magnetic anomalies from data collected across zones in Georgia and concludes that the Brunswick Magnetic Anomaly has a similar, deeply buried source. The anomalous magnetic signal is consistent with an older tectonic event -- the Alleghanian orogeny that formed the Alleghany-Appalachian Mountains when the supercontinent of Pangea was assembled.

Parker's main conclusion is that the rocks responsible for the Brunswick Magnetic Anomaly mark a major fault-zone that formed as portions of Africa and North America were sheared together roughly 300 million years ago -- and that more extensive evidence for this collision are preserved along this zone. One interesting implication is that perhaps a larger portion of what is now Africa was left behind in the American southeast when Pangea later broke up.

Source: Geological Society of America
 
Support : Creating Website | Johny Template | Mas Template
Copyright © 2011. The planet wall - All Rights Reserved
Template Created by Easy Blogging Published by Mas Template
Proudly powered by Blogger