Latest Post
Showing posts with label NATIONAL WEATHER SERVICE. Show all posts

NOAA’s investments in weather models and partnerships paying off

Written By Unknown on Tuesday, February 3, 2015 | 2:24 AM

Early improvements effective in forecasting recent Nor’easter; future forecast model upgrades planned
As the Northeast digs out from this week’s blizzard, a new NOAA-led effort to improve the forecasting of such high impact weather events is reaching an important early benchmark. One of the first major improvements - upgrading the resolution of three global forecast models -- has already shown its effectiveness. One of these models, the newly upgraded Global Forecast System (GFS) model, provided one of the most precise forecasts of the track, intensity, precipitation, and distribution of the Nor’easter. The other research models provided important forecast information, as well.

“The Global Forecast System did remarkably well in the recent Nor’easter,” said Louis Uccellini, director of NOAA’s National Weather Service. “This is due to the recent improvements we’ve made to the GFS, including higher resolution, improved physics, and better access to new data. With the help of scientists at NOAA Research, we’re making improvements to all our models, and upgrading supercomputers to improve our ability to translate data into actionable information, and to produce more timely, accurate and reliable forecasts.”

By the end of January, the $13 million project called the High Impact Weather Prediction Project (HIWPP), funded by Congress in the wake of Hurricane Sandy, will have improved the resolution on the global forecast model operated by NOAA Research Earth System Research Laboratory and the model operated by the U.S. Navy.
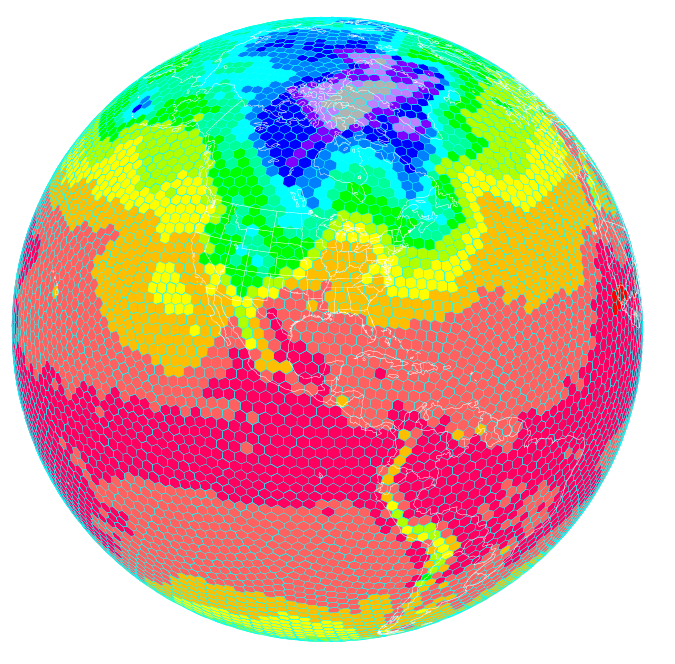
Improving global models
Scientists at NOAA’s Earth System Research Laboratory are running a high resolution global forecast model called the FIM, or Flow following finite volume Icoschedral Model. As depicted here, the FIM uses a unique grid that allows for a more uniform representation of the Earth. Higher resolution models are helping improve severe weather prediction. (NOAA)

In addition, NOAA researchers have written and installed programs to enable these three global models to work together effectively, which provides greater accuracy and confidence in forecasts. The third improvement is a plan to actively involve the broader weather forecasting community, including other public, academic and private sector scientists, in the evaluation of how these models work together to refine and improve forecasts.

“We are always looking for ways to improve the reliability and accuracy of our forecasts and models,” said John Cortinas, director of NOAA’s Office of Weather and Air Quality, who is overseeing HIWPP, which involves researchers from NOAA’s Oceanic and Atmospheric Research, NOAA’s National Weather Service, cooperative institutes, other government and academic partners.

“The goal of the project is to develop the next generation of weather forecast models that will eventually extend our ability to skillfully forecast high-impact weather out to several weeks and beyond,” Cortinas said. “By extending lead time for forecasts on storms like the one we’ve just experienced, cities and towns can better plan for these events, potentially saving lives and helping protect valuable land, homes and businesses. Businesses and industry can better plan everything from shipping to safe routing of air traffic to energy consumption. For ordinary citizens, it will be easier to plan an event or a trip.”

Over the last decades, weather forecasts have improved steadily so that we now have accurate forecasts out to five days, with reasonable accuracy to seven days. “We’ve gained about a day a decade in accuracy,” said Timothy Schneider, a research meteorologist at NOAA’s Earth System Research Laboratory, who is working to improve global forecast models. “Gaining a day of accuracy involves a combination of improving the science, adding computer power and increasing the necessary observations. With this project, we’re trying to accelerate this progress to make quicker gains.”

Global weather data key to improved local forecasts

“We know we can get better weather forecasts by improving the resolution of global forecast models so they depict weather in finer and finer detail,” explained Schneider. The resolution of NOAA’s two global forecast models has improved from grids that are 24 kilometers, to ones that are about 13 kilometers.  “The finer you chop up the picture, the more you can see of what is happening inside a particular storm. This helps us make better forecasts.”

 “If we’re going to predict weather out beyond seven and 10 days, we need even better global weather forecast models that show us what’s occurring on the other side of the Earth,” added Schneider. “Weather patterns on one side of the globe travel around the Earth and evolve. Storms born in the western Pacific follow air patterns that can create major winter storms on the West Coast, and weather patterns off the coast of Africa can spawn hurricanes in the U.S.”

Source: NOAA

Building a Better Weather Forecast? SMAP May Help

Written By Unknown on Saturday, January 31, 2015 | 5:34 AM

SMAP's soil moisture measurements will help with forecasts of precipitation and temperature. Image credit: UCAR
If you were trying to forecast tomorrow's weather, you would probably look up at the sky rather than down at the ground. But if you live in the U.S. Midwest or someplace with a similar climate, one key to a better weather forecast may lie beneath your feet.

Precipitation and temperature are part of every weather forecast. Precipitation comes from clouds, clouds are formed of airborne water vapor, and vapor comes from evaporating soil moisture -- so soil moisture governs precipitation. Evaporating soil moisture also makes air cooler, so it affects temperature. In certain kinds of climate, scientists believe, soil moisture is so influential that better observations of it might improve weather forecasts. These climates are transitional: not too humid and not too dry. For example, the agriculturally productive states of the U.S. Midwest fall into that category.

"Better soil moisture observations lead to better land-atmosphere interaction in weather forecasting models and ultimately to a better prediction of temperature and precipitation," said Michael Ek, leader of the Land Hydrology Team at the Environmental Monitoring Center of the National Oceanic and Atmospheric Administration (NOAA). "Weather models need good initial observations of the land surface, or you're starting from the wrong place."

Better soil moisture observations are just what the Soil Moisture Active Passive (SMAP) mission will provide. Scheduled for launch on Jan. 29, SMAP will collect the most accurate and highest-resolution soil moisture measurements ever made from a satellite SMAP will cover the entire globe in two to three days. Ek is a member of one of five groups in SMAP's Early Adopter program that have been working for several years on the question of how best to incorporate the new data into national weather forecasting models.

Forecasts will not improve, however, the moment SMAP starts collecting data. U.S. Department of Agriculture research scientist Wade Crow, a member of SMAP's science team, explained that, since closely spaced global soil moisture measurements have never existed before, the mathematical models used in weather forecasting are not configured to include them directly. Getting the best use out of the new observations has been a subject of active research for several years and will require some significant changes in how soil moisture data are assimilated into the models.

Data assimilation is necessary because weather forecasting models all drift a bit, like cars. If you're driving on a perfectly straight road, you still need to keep a hand on the steering wheel or you'll run off the edge sooner or later. Data assimilation in a model serves the same purpose as the slight movements of your hands that keep your car on course.

Drift is not a fatal flaw for a weather forecasting model any more than it is for a car. It is simply a sign that the Earth system is too vast and complicated to model perfectly with the resources available today. To steer forecasts toward greater realism, models ingest, or assimilate, real-world data and use them in sophisticated mathematical techniques. Each time updated observations become available, they are assimilated to improve the starting point for the next forecast.

Closely spaced and highly accurate global measurements are an important part of the process. For soil moisture, however, current observations are not on a fine enough scale to meet the needs of weather forecasting models directly. "Modelers compensate for the lack of direct observations of soil moisture by using more indirect measures, such as estimating it from observations of temperature and precipitation," Crow explained. "As a consequence, modeled soil moisture tends to diverge from reality. SMAP will be directly observing the state that they want, so they won't have to back it out from proxy measurements."

JPL scientist Eni Njoku is working with researchers at another forecasting center, the European Centre for Medium-Range Weather Forecasts (ECMWF) in Reading, England. Njoku said, "SMAP will provide benefits of higher soil moisture accuracy and spatial resolution than have previously been available from satellites. This could lead potentially to improved regional and global weather forecasts by ECMWF." Environment Canada, the branch of the Canadian government responsible for weather forecasting in that nation, is also working on assimilating SMAP data into its models.

"The numerical weather prediction centers are adapting to the new availability of soil moisture information and thinking of ways they can exploit it," Crow summarized. "It will be really exciting to see what they find."

SMAP is managed for NASA's Science Mission Directorate in Washington by the agency's Jet Propulsion Laboratory in Pasadena, California, with instrument hardware and science contributions made by NASA's Goddard Space Flight Center in Greenbelt, Maryland. JPL is responsible for project management, system engineering, radar instrumentation, mission operations and the ground data system. Goddard is responsible for the radiometer instrument. Both centers collaborate on science data processing and delivery to the Alaska Satellite Facility, in Fairbanks, and the National Snow and Ice Data Center, at the University of Colorado in Boulder, for public distribution and archiving. NASA's Launch Services Program at the agency's Kennedy Space Center in Florida is responsible for launch management. JPL is managed for NASA by the California Institute of Technology in Pasadena.

Source: Nasa

Long-running Jason-1 ocean satellite takes final bow

Written By Unknown on Sunday, December 21, 2014 | 9:38 PM

Artist's concept of the joint NASA/CNES Jason-1 ocean altimetry satellite. During its 11-1/2-year life, Jason-1 helped create a 20-plus-year climate record of global ocean surface topography, providing new insights into ocean circulation, tracking our rising seas and enabling more
The curtain has come down on a superstar of the satellite oceanography world that played the "Great Blue Way" of the world's ocean for 11-1/2 years. The successful joint NASA and Centre National d'Etudes Spatiales (CNES) Jason-1 ocean altimetry satellite was decommissioned this week following the loss of its last remaining transmitter.
Launched Dec. 7, 2001, and designed to last three to five years, Jason-1 helped create a revolutionary 20-plus-year climate data record of global ocean surface topography that began in 1992 with the launch of the NASA/CNES Topex/Poseidon satellite. For more than 53,500 orbits of our planet, Jason-1 precisely mapped sea level, wind speed and wave height for more than 95 percent of Earth's ice-free ocean every 10 days. The mission provided new insights into ocean circulation, tracked our rising seas and enabled more accurate weather, ocean and climate forecasts.
"Jason-1 has been a resounding scientific, technical and international success," said John Grunsfeld, associate administrator of NASA's Science Mission Directorate in Washington. 

"The mission met all of its requirements, performed an extended mission and demonstrated how a long-term climate data record should be established from successively launched satellites. Since launch, it has charted nearly 1.6 inches (4 centimeters) of rise in global sea levels, a critical measure of climate change and a direct result of global warming. The Jason satellite series provides the most accurate measure of this impact, which is felt all over the globe."

During parts of its mission, Jason-1 flew in carefully coordinated orbits with both its predecessor Topex/Poseidon and its successor, the Ocean Surface Topography Mission/Jason-2, launched in 2008. These coordinated orbit periods, which lasted about three years each, cross-calibrated the satellites, making possible a 20-plus-year unbroken climate record of sea level change. These coordination periods also doubled data coverage.

Combined with data from the European Space Agency's Envisat mission, which also measured sea level from space, these data allow scientists to study smaller-scale ocean circulation phenomena, such as coastal tides, ocean eddies, currents and fronts. These small-scale features are thought to be responsible for transporting and mixing heat and other properties, such as nutrients and dissolved carbon dioxide, within the ocean.

"Jason-1 was an exemplary and multi-faceted altimeter mission and contributed so much to so many scientific disciplines," said Jean-Yves Le Gall, CNES president in Paris. "Not only did Jason-1 extend the precise climate record established by Topex/Poseidon, it made invaluable observations for mesoscale ocean studies on its second, interleaved orbit. Even from its 'graveyard' orbit, Jason-1 continued to make unprecedented new observations of the Earth's gravity field, with precise measurements right till the end."

The in-orbit Jason-2 mission, operated by the meteorological agencies of the United States and Europe (the National Oceanic and Atmospheric Administration and EUMETSAT, respectively) in collaboration with NASA and CNES, is in good health and continues to collect science and operational data. This same U.S./European team is preparing to launch the next satellite in the series, Jason-3, in March 2015.

Contact was lost with the Jason-1 satellite on June 21 when it was out of visibility of ground stations. At the time of the last contact, Jason-1 and its instruments were healthy, with no indications of any alarms or anomalies. Subsequent attempts to re-establish spacecraft communications from U.S. and French ground stations were unsuccessful. Extensive engineering operations undertaken to recover downlink communications also were unsuccessful.

After consultation with the spacecraft and transmitter manufacturers, it was determined a non-recoverable failure with the last remaining transmitter on Jason-1 was the cause of the loss of contact. The spacecraft's other transmitter experienced a permanent failure in September 2005. There now is no remaining capability to retrieve data from the Jason-1 spacecraft.
On July 1, mission controllers commanded Jason-1 into a safe hold state that reinitialized the satellite. After making several more unsuccessful attempts to locate a signal, mission managers at CNES and NASA decided to proceed with decommissioning Jason-1. The satellite was then commanded to turn off its magnetometer and reaction wheels. Without these attitude control systems, Jason-1 and its solar panels will slowly drift away from pointing at the sun and its batteries will discharge, leaving it totally inert within the next 90 days. The spacecraft will not reenter Earth's atmosphere for at least 1,000 years.
"Like its predecessor Topex/Poseidon, Jason-1 provided one of the most comprehensive pictures of changes in the tropical Pacific Ocean, including the comings and goings of El Nino and La Nina events," said Lee-Lueng Fu, Jason-1 project scientist at NASA's Jet Propulsion Laboratory in Pasadena, Calif. "These Pacific Ocean climate cycles are responsible for major shifts in sea level, ocean temperatures and rainfall every two to five years and can sometimes be so large that worldwide weather patterns are affected. Jason-1 data have been instrumental in monitoring and predicting these ever-changing cycles."
In the spring of 2012, based on concern over the limited redundancy of Jason-1's aging control systems, NASA and CNES moved the satellite into its planned final "graveyard" orbit, depleted its extra fuel and reconfigured the mission to make observations that will improve our knowledge of Earth's gravity field over the ocean, in addition to delivering its oceanographic data products.

The first full 406-day marine gravity mission was completed on June 17. The resulting data have already led to the discovery of numerous small seamounts, which are underwater mountains that rise above the deep-sea floor. The data also have significantly increased the resolution of Earth's gravity field over the ocean, while increasing our knowledge of ocean bathymetry, which is the underwater depth of the ocean floor.

JPL manages the U.S. portion of the Jason-1 mission for NASA's Science Mission Directorate. CNES manages the French portion of the mission.

Tornado strength, frequency, linked to climate change

Tornado (stock image). New research by a Florida State University geography professor shows that climate change may be playing a key role in the strength and frequency of tornadoes hitting the United States. Credit: © fotola70 / Fotolia
New research by a Florida State University geography professor shows that climate change may be playing a key role in the strength and frequency of tornadoes hitting the United States.

Published Wednesday in the journal Climate Dynamics, Professor James Elsner writes that though tornadoes are forming fewer days per year, they are forming at a greater density and strength than ever before. So, for example, instead of one or two forming on a given day in an area, there might be three or four occurring.

"We may be less threatened by tornadoes on a day-to-day basis, but when they do come, they come like there's no tomorrow," Elsner said.
Elsner, an expert in climate and weather trends, said in the past, many researchers dismissed the impact of climate change on tornadoes because there was no distinct pattern in the number of tornado days per year. In 1971, there were 187 tornado days, but in 2013 there were only 79 days with tornadoes.
But a deeper dive into the data showed more severity in the types of storms and that more were happening on a given day than in previous years.

"I think it's important for forecasters and the public to know this," Elsner said. "It's a matter of making sure the public is aware that if there is a higher risk of a storm, there may actually be multiple storms in a day."

The United States experiences more tornadoes than any other country, and despite advances in technology and warning systems, they still remain a hazard to residents in storm-prone areas. The 2011 tornado season, for example, had nearly 1,700 storms and killed more than 550 people.

So far, in 2014, there have been 189 storms with a death toll of 43, according to the NOAA/National Weather Service Storm Prediction Center.

One bright spot of news in the research, Elsner added, was that the geographic areas impacted most regularly by tornadoes do not appear to be growing.

Elsner was joined on the paper by independent researcher Thomas H. Jagger, formerly a research associate at Florida State University, and meteorologist Svetoslava Elsner.

Source: Florida State University

U.S. releases enhanced shuttle land elevation data

Shaded relief images of deeply eroded volcanic terrain in northeast Tanzania demonstrate the improved nature of the highest-resolution SRTM data now being released. The image at left has data samples spaced every 90 meters (295 feet); the image at right has samples spaced every 30 meters (98 feet). Credit: NASA/JPL-Caltech/National Geospatial Intelligence Agency
High-resolution topographic data generated from NASA's Shuttle Radar Topography Mission (SRTM) in 2000, previously only available for the United States, will be released globally over the next year, the White House announced today. The announcement was made at the United Nations Heads of State Climate Summit in New York.

This initial public release of topographic data for Africa will help empower local authorities to better plan for the impacts of severe environmental changes such as drought, glacial retreat, inland flooding, landslides and coastal storm surges. Datasets covering the remaining continents will be made available within one year, with the next release of data focusing on Latin America and the Caribbean.

Lower-resolution SRTM topographic data having 90-meter (295-foot) pixels were released publicly in 2003 for many parts of the world, providing a global standard for many applications. The new data increase the detail to 30-meter (98-foot) pixel spacing, now revealing the full resolution of the world's landforms as originally measured by SRTM.
"The public availability of enhanced global SRTM topographic data will greatly benefit international efforts to better understand natural processes that shape our planet, prepare for and respond to natural hazards, and anticipate and prepare for the impacts of global change," said NASA Chief Scientist Ellen Stofan. "NASA is proud to have played a critical role in creating these data that will benefit society through open data sharing."
SRTM was a joint project of NASA, the German and Italian space agencies, and the National Geospatial-Intelligence Agency. It was managed by NASA's Jet Propulsion Laboratory, Pasadena, California, for NASA's Science Mission Directorate, Washington, D.C. The newly released 30-meter topographic data products will be publicly distributed by the U.S.  
Geological Survey (USGS) along with the 90-meter data. These data are being made available via a user-friendly interface on USGS's Earth Explorer website.
SRTM flew aboard the Space Shuttle Endeavour in February 2000, mapping Earth's topography between 56 degrees south and 60 degrees north of the equator. During the 11-day mission, SRTM used an imaging radar to map the surface of Earth numerous times from different perspectives. The combination of these radar data were processed at JPL to produce a global topographic map created by bouncing radar signals off Earth's surface and back to the shuttle.
Topographic data benefit a wide variety of activities, from aviation safety to civil engineering projects. Topography also strongly influences many natural processes, such as the distribution of plant communities and the associated animals that depend upon them, weather and rainfall patterns, and the flow and storage of surface water. The data aid in better understanding, predicting and responding to flooding from severe storms and the threats of coastal inundation associated with storm surge, tsunamis and sea-level rise.

Multiple training workshops on SRTM data are planned for users in Africa. The SERVIR program, a joint venture by NASA and the U.S. Agency for International Development, is planning workshops in Eastern and Southern Africa with the Regional Centre for Mapping of Resources for Development, and in West Africa with key environmental organizations. 

The Secure World Foundation is partnering with NASA, USGS and other members of the international Committee on Earth Observation Satellites to offer online training and regional workshops to further enable users to take advantage of these data resources. JPL is a division of the California Institute of Technology in Pasadena.

Source: NASA/Jet Propulsion Laboratory
 
Support : Creating Website | Johny Template | Mas Template
Copyright © 2011. The planet wall - All Rights Reserved
Template Created by Easy Blogging Published by Mas Template
Proudly powered by Blogger