Latest Post
Showing posts with label EARTH'S ATMOSPHERE. Show all posts

What is the Benefits of ISS Research - A interview Video

Written By Unknown on Saturday, February 7, 2015 | 5:55 PM

Earth framing the International Space Station

Earth framing the International Space Station in May 2010 following undocking of Atlantis during the STS-132 mission. (NASA)

Almost as soon as the International Space Station was habitable, researchers began using it to study the impact of microgravity and other space effects on several aspects of our daily lives. This unique scientific platform continues to enable researchers from all over the world to put their talents to work on innovative experiments that could not be done anywhere else. 

Although each space station partner has distinct agency goals for station research, each partner shares a unified goal to extend the resulting knowledge for the betterment of humanity. We may not know yet what will be the most important discovery gained from the space station, but we already have some amazing breakthroughs! In the areas of human health, telemedicine, education and observations of Earth from space, there are already demonstrated benefits to human life. Vaccine development research, station-generated images that assist with disaster relief and farming, and education programs that inspire future scientists, engineers and space explorers are just some examples of research benefits. 

The stories featured here summarize the scientific, technological and educational accomplishments of research on the space station that has and will continue to have an impact on life on Earth.

The benefits outlined here serve as examples of the space station's potential as a groundbreaking scientific research facility. Through advancing the state of scientific knowledge of our planet, looking after our health, and providing a space platform that inspires and educates the science and technology leaders of tomorrow, these benefits will drive the legacy of the space station as its research strengthens economies and enhances the quality of life here on Earth for all people.

WATCH VIDEO HERE


Source: Nasa

NOAA’s investments in weather models and partnerships paying off

Written By Unknown on Tuesday, February 3, 2015 | 2:24 AM

Early improvements effective in forecasting recent Nor’easter; future forecast model upgrades planned
As the Northeast digs out from this week’s blizzard, a new NOAA-led effort to improve the forecasting of such high impact weather events is reaching an important early benchmark. One of the first major improvements - upgrading the resolution of three global forecast models -- has already shown its effectiveness. One of these models, the newly upgraded Global Forecast System (GFS) model, provided one of the most precise forecasts of the track, intensity, precipitation, and distribution of the Nor’easter. The other research models provided important forecast information, as well.

“The Global Forecast System did remarkably well in the recent Nor’easter,” said Louis Uccellini, director of NOAA’s National Weather Service. “This is due to the recent improvements we’ve made to the GFS, including higher resolution, improved physics, and better access to new data. With the help of scientists at NOAA Research, we’re making improvements to all our models, and upgrading supercomputers to improve our ability to translate data into actionable information, and to produce more timely, accurate and reliable forecasts.”

By the end of January, the $13 million project called the High Impact Weather Prediction Project (HIWPP), funded by Congress in the wake of Hurricane Sandy, will have improved the resolution on the global forecast model operated by NOAA Research Earth System Research Laboratory and the model operated by the U.S. Navy.
Improving global models
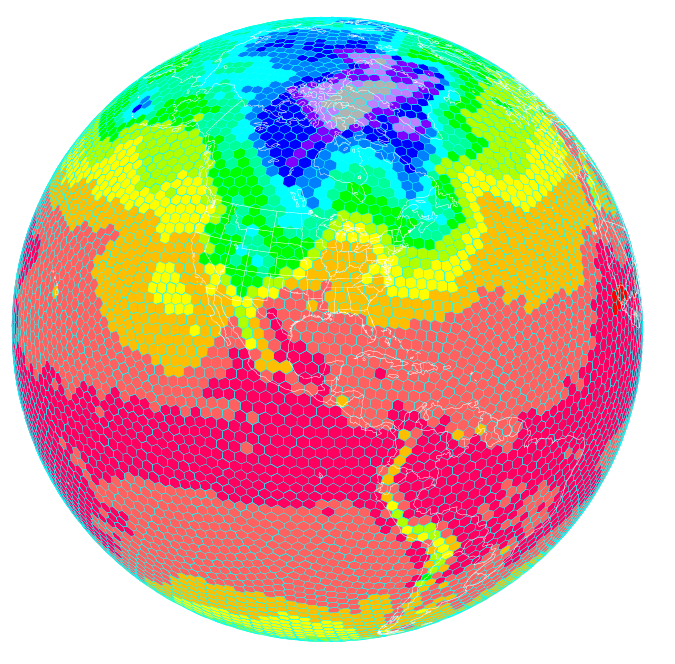
Scientists at NOAA’s Earth System Research Laboratory are running a high resolution global forecast model called the FIM, or Flow following finite volume Icoschedral Model. As depicted here, the FIM uses a unique grid that allows for a more uniform representation of the Earth. Higher resolution models are helping improve severe weather prediction. (NOAA)

In addition, NOAA researchers have written and installed programs to enable these three global models to work together effectively, which provides greater accuracy and confidence in forecasts. The third improvement is a plan to actively involve the broader weather forecasting community, including other public, academic and private sector scientists, in the evaluation of how these models work together to refine and improve forecasts.

“We are always looking for ways to improve the reliability and accuracy of our forecasts and models,” said John Cortinas, director of NOAA’s Office of Weather and Air Quality, who is overseeing HIWPP, which involves researchers from NOAA’s Oceanic and Atmospheric Research, NOAA’s National Weather Service, cooperative institutes, other government and academic partners.

“The goal of the project is to develop the next generation of weather forecast models that will eventually extend our ability to skillfully forecast high-impact weather out to several weeks and beyond,” Cortinas said. “By extending lead time for forecasts on storms like the one we’ve just experienced, cities and towns can better plan for these events, potentially saving lives and helping protect valuable land, homes and businesses. Businesses and industry can better plan everything from shipping to safe routing of air traffic to energy consumption. For ordinary citizens, it will be easier to plan an event or a trip.”

Over the last decades, weather forecasts have improved steadily so that we now have accurate forecasts out to five days, with reasonable accuracy to seven days. “We’ve gained about a day a decade in accuracy,” said Timothy Schneider, a research meteorologist at NOAA’s Earth System Research Laboratory, who is working to improve global forecast models. “Gaining a day of accuracy involves a combination of improving the science, adding computer power and increasing the necessary observations. With this project, we’re trying to accelerate this progress to make quicker gains.”

Global weather data key to improved local forecasts

“We know we can get better weather forecasts by improving the resolution of global forecast models so they depict weather in finer and finer detail,” explained Schneider. The resolution of NOAA’s two global forecast models has improved from grids that are 24 kilometers, to ones that are about 13 kilometers.  “The finer you chop up the picture, the more you can see of what is happening inside a particular storm. This helps us make better forecasts.”

 “If we’re going to predict weather out beyond seven and 10 days, we need even better global weather forecast models that show us what’s occurring on the other side of the Earth,” added Schneider. “Weather patterns on one side of the globe travel around the Earth and evolve. Storms born in the western Pacific follow air patterns that can create major winter storms on the West Coast, and weather patterns off the coast of Africa can spawn hurricanes in the U.S.”

Source: NOAA

NCDC Releases 2014 U.S. Climate Report

Written By Unknown on Monday, February 2, 2015 | 9:20 PM

The 2014 annual average contiguous U.S. temperature was 52.6°F, 0.5°F above the 20th century average. This ranked as the 34th warmest year in the 1895–2014 record. Very warm conditions dominated the West, while the Midwest and Mississippi Valley were cool.

The average contiguous U.S. precipitation was 30.76 inches, 0.82 inch above average, and ranked as the 40th wettest year in the 120-year period of record. The northern United States was wet, and the Southern Plains were dry; the national drought footprint shrank about 2 percent. 

In 2014, there were eight weather and climate disaster events with losses exceeding $1 billion each across the United States. These eight events resulted in the deaths of 53 people. The events include: the western U.S. drought, the Michigan and Northeast flooding event, five severe storm events, and one winter storm event. 

This summary from NOAA's National Climatic Data Center is part of the suite of climate services NOAA provides to government, business, academia, and the public to support informed decision making.

Source: NOAA


Atmospheric warming heats the bottom of ice sheets, as well as the top

Written By Unknown on Saturday, January 31, 2015 | 4:27 PM

A 70-meter-deep basin formed near the summit of Greenland’s Flade Isblink Ice Cap in the fall of 2012 when a lake 540 meters beneath the ice surface suddenly emptied. Summer meltwater streams on the ice cap surface (blue) enter crevasses near the bottom of the image. Photo Credit: WorldView-2 Imagery (c) 2014, DigitalGlobe, Inc.
University of Minnesota researchers are part of a national team of scientists that has published a new paper showing for the first time that meltwater from the surface of an ice cap in northeastern Greenland can make its way beneath the ice and become trapped, refilling a subglacial lake. This meltwater provides heat to the bottom of the ice sheet.

These groundbreaking findings provide new information about atmospheric warming and its affect on the critical zone at the base of the ice. The warmth provided by the water could make the ice sheet move faster and alter how it responds to the changing climate.

The research is detailed in a new paper published today online by the journal Nature. The research was led by Cornell University Earth and Atmospheric Sciences researcher Michael Willis, who is also an adjunct faculty member in the geological sciences department at UNC-Chapel Hill's College of Arts and Sciences. The research study’s co-authors are Bradley Herried, University of Minnesota School of Earth Science’s Polar Geospatial Center; Michael Bevis, Ohio State University School of Earth Sciences; and Robin Bell, Columbia University Lamont Doherty Earth Observatory.

“We’re seeing surface meltwater make its way to the base of the ice where it can get trapped and stored at the boundary between the bedrock beneath the ice sheet and the ice itself,” Willis said. “As the lake beneath the ice fills with surface meltwater, the heat released by this trapped meltwater can soften surrounding ice, which may eventually cause an increase in ice flow.”

The researchers were able to pinpoint when the subglacial lake refilled using data collected from high-resolution satellite images from the University of Minnesota’s Polar Geospatial Center, as well as data from NASA’s operation IceBridge for calibration and verification.

The direct link between the surface meltwater and the filling of a lake at the base of the ice has never been seen before. Over the last few years the number of lakes on the surface of the Greenland ice sheet has greatly increased. Surface lakes are also occurring much farther inland at higher altitudes than in the past. If this mechanism of transferring water and warmth from the surface lakes to the bottom of the ice sheet is common then the Greenland Ice Sheet is likely to respond more rapidly to climate change than is currently predicted.

The Greenland ice sheet comprises about 80 percent of the land mass of Greenland and previous studies have documented that the ice sheet is melting at a faster rate due to climate change. The movement of meltwater beneath the ice sheet, from the interior to the ocean, is the topic of many investigations as it can control the speed at which the ice sheet moves. This is the first study to document that surface water can penetrate to the bottom of an ice cap and be trapped in place. Researchers say this process could also occur at other large bodies of ice.

The study was sparked in 2012 when Willis was mapping ice changes around the edge of the Greenland Ice Sheet as part of a study funded by U.S. National Science Foundation (NSF) to understand how much of the accelerating ice loss in Greenland is caused by melting and how much is caused by the increase of ice moving into the ocean.

During his research, Willis spotted a 70-meter-deep hole (the equivalent of a 10-story building) that had formed when a subglacial lake, far beneath the ice surface, emptied in the late fall of 2011. Subglacial lakes are rare in Greenland, and the presence of such a lake in the far northeast came as a surprise. The ice in this region is much too slow, too cold and too thin to allow melting beneath the ice cap, which is how a subglacial lake usually forms. 

Between 2012 and 2014, Willis watched as summer meltwater on the surface of the ice made its way down cracks around the hole and refilled the empty lake basin at the base of the ice cap. When water was flowing on the surface, the subglacial lake filled. When water stopped flowing on the surface, the subglacial lake stopped refilling.

Each summer scientists see bright blue streams form on the surface of Greenland as warm air melts the ice sheet. What happens to this water when it disappears into cracks in the ice has remained a mystery.

“This discovery that water can be stored in lakes beneath the ice shows how the plumbing on the surface is linked to the plumbing at the base," said co-author Bell.

The Cornell-led team calculated that the lake beneath the ice has filled about half way since its 2011 blowout that originally drove water from the lake at a volume of 215 cubic meters per second (nearly 57,000 gallons—close to the volume of a 30-foot-by-50-foot backyard swimming pool every second.)  As the lake refills, the surface meltwater carries stored heat, called latent heat, along with it from the relatively warm atmosphere to the icy depths. This latent heat reduces the stiffness of the surrounding ice and makes the ice more likely to flow out to sea.

Even though researchers have long known of the existence of subglacial lakes, never before have they witnessed any refilling from the surface. The refilling signals to researchers that Greenland’s ice loss has likely reached a milestone.

"We can actually see the meltwater pour down into these holes and then watch these subglacial lakes drain out and fill up again in real time,” said study co-author Bevis. “With melting like that, even the deep interior of the ice sheet is going to change. If enough water is pouring down into the Greenland Ice Sheet for us to see the same subglacial lake empty and refill itself over and over, then there must be so much latent heat being released under the ice that we’d have to expect it to change the large-scale behavior of the ice sheet.”

Source: University of Minnesota

Cassini Catches Titan Naked in the Solar Wind

This diagram depicts conditions observed by NASA's Cassini spacecraft during a flyby in Dec. 2013, when Saturn's magnetosphere was highly compressed, exposing Titan to the full force of the solar wind. Image credit: NASA/JPL-Caltech
Researchers studying data from NASA's Cassini mission have observed that Saturn's largest moon, Titan, behaves much like Venus, Mars or a comet when exposed to the raw power of the solar wind. The observations suggest that unmagnetized bodies like Titan might interact with the solar wind in the same basic ways, regardless of their nature or distance from the sun.

Titan is large enough that it could be considered a planet if it orbited the sun on its own, and a flyby of the giant moon in Dec. 2013 simulated that scenario, from Cassini's vantage point. The encounter was unique within Cassini's mission, as it was the only time the spacecraft has observed Titan in a pristine state, outside the region of space dominated by Saturn's magnetic field, called its magnetosphere.

"We observed that Titan interacts with the solar wind very much like Mars, if you moved it to the distance of Saturn," said Cesar Bertucci of the Institute of Astronomy and Space Physics in Buenos Aires, who led the research with colleagues from the Cassini mission. "We thought Titan in this state would look different. We certainly were surprised," he said.

The solar wind is a fast-flowing gale of charged particles that continually streams outward from the sun, flowing around the planets like islands in a river. Studying the effects of the solar wind at other planets helps scientists understand how the sun's activity affects their atmospheres. These effects can include modification of an atmosphere's chemistry as well as its gradual loss to space.

Titan spends about 95 percent of the time within Saturn's magnetosphere. But during a Cassini flyby on Dec. 1, 2013, the giant moon happened to be on the sunward side of Saturn when a powerful outburst of solar activity reached the planet. The strong surge in the solar wind so compressed the sun-facing side of Saturn's magnetosphere that the bubble's outer edge was pushed inside the orbit of Titan. This left the moon exposed to, and unprotected from, the raging stream of energetic solar particles.

Using its magnetometer instrument, which is akin to an equisitely sensitive compass, Cassini has observed Titan many times during the mission's decade in the Saturn system, but always within Saturn's magnetosphere. The spacecraft has not been able to detect a magnetic field coming from Titan itself. In its usual state, Titan is cloaked in Saturn's magnetic field.

This time the influence of Saturn was not present, allowing Cassini's magnetometer to observe Titan as it interacted directly with the solar wind. The special circumstance allowed Bertucci and colleagues to study the shockwave that formed around Titan where the full-force solar wind rammed into the moon's atmosphere.

At Earth, our planet's powerful magnetic field acts as a shield against the solar wind, helping to protect our atmosphere from being stripped away. In the case of Venus, Mars and comets -- none of which is protected by a global magnetic field -- the solar wind drapes around the objects themselves, interacting directly with their atmospheres (or in the comet's case, its coma). Cassini saw the same thing at Titan.

Researchers thought they would have to treat Titan's response to the solar wind with a unique approach because the chemistry of the hazy moon's dense atmosphere is highly complex. But Cassini's observations of a naked Titan hinted at a more elegant solution. "This could mean we can use the same tools to study how vastly different worlds, in different parts of the solar system, interact with the wind from the sun," Bertucci said.

Bertucci noted that the list of similarly unmagnetized bodies might include the dwarf planet Pluto, to be visited this year for the first time by NASA's New Horizons spacecraft.

"After nearly a decade in orbit, the Cassini mission has revealed once again that the Saturn system is full of surprises," said Michele Dougherty, principal investigator of the Cassini magnetometer at Imperial College, London. "After more than a hundred flybys, we have finally encountered Titan out in the solar wind, which will allow us to better understand how such moons maintain or lose their atmospheres."

The new research is published today in the journal Geophysical Review Letters.

The Cassini-Huygens mission is a cooperative project of NASA, the European Space Agency and the Italian Space Agency. NASA's Jet Propulsion Laboratory, a division of the California Institute of Technology in Pasadena, manages the mission for NASA's Science Mission Directorate, Washington, D.C. JPL designed, developed and assembled the Cassini orbiter. The magnetometer team is based at Imperial College, London, U.K.

Source: Nasa

New Online Course Explores Social and Ecological Diversity of Himalayan Region

Written By Unknown on Friday, January 30, 2015 | 1:10 AM

The conversion of forests into cropland worldwide has triggered an atmospheric change that, while seldom considered in climate models, has had a net cooling effect on global temperatures, according to a new Yale study.

Writing in the journal Nature Climate Change, Professor Nadine Unger of the Yale School of Forestry & Environmental Studies (F&ES) reports that large-scale forest losses during the last 150 years have reduced global emissions of biogenic volatile organic compounds (BVOCs), which control the atmospheric distribution of many short-lived climate pollutants, such as tropospheric ozone, methane, and aerosol particles.

Using sophisticated climate modeling, Unger calculated that a 30-percent decline in BVOC emissions between 1850 and 2000, largely through the conversion of forests to cropland, produced a net global cooling of about 0.1 degrees Celsius. During the same period, the global climate warmed by about 0.6 degrees Celsius, mostly due to increases in fossil fuel carbon dioxide emissions.

According to her findings, the climate impact of declining BVOC emissions is on the same magnitude as two other consequences of deforestation long known to affect global temperatures, although in opposing ways: carbon storage and the albedo effect. The lost carbon storage capacity caused by forest conversion has exacerbated global warming. 
Meanwhile, the disappearance of dark-colored forests has also helped offset temperature increases through the so-called albedo effect. (The albedo effect refers to the amount of radiation reflected by the surface of the planet. Light-colored fields, for instance, reflect more light and heat back into space than darker forests.)
“Without doing an earth-system model simulation that includes these factors, we can’t really know the net effect on the global climate.”— Nadine Unger
Unger says the combined effects of reduced BVOC emissions and increased albedo may have entirely offset the warming caused by the loss of forest-based carbon storage capacity.

“Land cover changes caused by humans since the industrial and agricultural revolutions have removed natural forests and grasslands and replaced them with croplands,” said Unger, an assistant professor of atmospheric chemistry at F&ES. “And croplands are not strong emitters of these BVOCs — often they don’t emit any BVOCs.”

“Without doing an earth-system model simulation that includes these factors, we can’t really know the net effect on the global climate. Because changes in these emissions affect both warming and cooling pollutants,” she noted.

Unger said the findings do not suggest that increased forest loss provides climate change benefits, but rather underscore the complexity of climate change and the importance of better assessing which parts of the world would benefit from greater forest conservation.

Since the mid-19th century, the percentage of the planet covered by cropland has more than doubled, from 14 percent to 37 percent. Since forests are far greater contributors of BVOC emissions than crops and grasslands, this shift in land use has removed about 30 percent of Earth’s BVOC sources, Unger said.

Not all of these compounds affect atmospheric chemistry in the same way. Aerosols, for instance, contribute to global “cooling” since they generally reflect solar radiation back into space. Therefore, a 50 percent reduction in forest aerosols has actually spurred greater warming since the pre-industrial era.
“[These emissions] don’t get as much attention as human-generated emissions... but if we change how much forest cover exists, then there is a human influence on these emissions.”— Nadine Unger
However, reductions in the potent greenhouse gases methane and ozone — which contribute to global warming — have helped deliver a net cooling effect.

These emissions are often ignored in climate modeling because they are perceived as a “natural” part of the earth system, explained Unger. “So they don’t get as much attention as human-generated emissions, such as fossil fuel VOCs,” she said. “But if we change how much forest cover exists, then there is a human influence on these emissions.”

These impacts have also been ignored in previous climate modeling, she said, because scientists believed that BVOC emissions had barely changed between the pre-industrial era and today. But a study published last year by Unger  showed that emissions of these volatile compounds have indeed decreased. Studies by European scientists have produced similar results.

The impact of changes to ozone and organic aerosols are particularly strong in temperate zones, she said, while methane impacts are more globally distributed.

The sensitivity of the global climate system to BVOC emissions suggests the importance of establishing a global-scale long-term monitoring program for BVOC emissions, Unger noted.

– Kevin Dennehy    kevin.dennehy@yale.edu    203 436-4842

Source: Yale University

Water vapor on Rosetta's target comet significantly different from that found on Earth

Written By Unknown on Friday, January 2, 2015 | 7:26 PM

First measurements of comet’s water ratio. Credit: Copyright Spacecraft: ESA/ATG medialab; Comet: ESA/Rosetta/NavCam; Data: Altwegg et al. 2014
ESA's Rosetta spacecraft has found the water vapour from its target comet to be significantly different to that found on Earth. The discovery fuels the debate on the origin of our planet's oceans.

The measurements were made in the month following the spacecraft's arrival at Comet 67P/Churyumov-Gerasimenko on 6 August. It is one of the most anticipated early results of the mission, because the origin of Earth's water is still an open question.

One of the leading hypotheses on Earth's formation is that it was so hot when it formed 4.6 billion years ago that any original water content should have boiled off. But, today, two thirds of the surface is covered in water, so where did it come from?
In this scenario, it should have been delivered after our planet had cooled down, most likely from collisions with comets and asteroids. The relative contribution of each class of object to our planet's water supply is, however, still debated.

The key to determining where the water originated is in its 'flavour', in this case the proportion of deuterium -- a form of hydrogen with an additional neutron -- to normal hydrogen.

This proportion is an important indicator of the formation and early evolution of the Solar System, with theoretical simulations showing that it should change with distance from the Sun and with time in the first few million years.

One key goal is to compare the value for different kinds of object with that measured for Earth's oceans, in order to determine how much each type of object may have contributed to Earth's water.

Comets in particular are unique tools for probing the early Solar System: they harbour material left over from the protoplanetary disc out of which the planets formed, and therefore should reflect the primordial composition of their places of origin.

But thanks to the dynamics of the early Solar System, this is not a straightforward process. Long-period comets that hail from the distant Oort cloud originally formed in Uranus-Neptune region, far enough from the Sun that water ice could survive.

They were later scattered to the Solar System's far outer reaches as a result of gravitational interactions with the gas giant planets as they settled in their orbits.

Conversely, Jupiter-family comets like Rosetta's comet were thought to have formed further out, in the Kuiper Belt beyond Neptune. Occasionally these bodies are disrupted from this location and sent towards the inner Solar System, where their orbits become controlled by the gravitational influence of Jupiter.

Indeed, Rosetta's comet now travels around the Sun between the orbits of Earth and Mars at its closest and just beyond Jupiter at its furthest, with a period of about 6.5 years.

Previous measurements of the deuterium/hydrogen (D/H) ratio in other comets have shown a wide range of values. Of the 11 comets for which measurements have been made, it is only the Jupiter-family Comet 103P/Hartley 2 that was found to match the composition of Earth's water, in observations made by ESA's Herschel mission in 2011.

By contrast, meteorites originally hailing from asteroids in the Asteroid Belt also match the composition of Earth's water. Thus, despite the fact that asteroids have a much lower overall water content, impacts by a large number of them could still have resulted in Earth's oceans.

It is against this backdrop that Rosetta's investigations are important. Interestingly, the D/H ratio measured by the Rosetta Orbiter Spectrometer for Ion and Neutral Analysis, or ROSINA, is more than three times greater than for Earth's oceans and for its Jupiter-family companion, Comet Hartley 2. Indeed, it is even higher than measured for any Oort cloud comet as well.

"This surprising finding could indicate a diverse origin for the Jupiter-family comets -- perhaps they formed over a wider range of distances in the young Solar System than we previously thought," says Kathrin Altwegg, principal investigator for ROSINA and lead author of the paper reporting the results in the journal Science this week.

"Our finding also rules out the idea that Jupiter-family comets contain solely Earth ocean-like water, and adds weight to models that place more emphasis on asteroids as the main delivery mechanism for Earth's oceans."

"We knew that Rosetta's in situ analysis of this comet was always going to throw up surprises for the bigger picture of Solar System science, and this outstanding observation certainly adds fuel to the debate about the origin of Earth's water," says Matt Taylor, ESA's Rosetta project scientist.

"As Rosetta continues to follow the comet on its orbit around the Sun throughout next year, we'll be keeping a close watch on how it evolves and behaves, which will give us unique insight into the mysterious world of comets and their contribution to our understanding of the evolution of the Solar System."

Source: ESA

Small volcanic eruptions could be slowing global warming

Written By Unknown on Sunday, December 21, 2014 | 11:21 PM

The Sarychev Peak Volcano, on Matua Island, erupted on June 12, 2009. New research shows that eruptions of this size may contribute more to the recent lull in global temperature increases than previously thought. Credit: NASA
Small volcanic eruptions might eject more of an atmosphere-cooling gas into Earth's upper atmosphere than previously thought, potentially contributing to the recent slowdown in global warming, according to a new study.

Scientists have long known that volcanoes can cool the atmosphere, mainly by means of sulfur dioxide gas that eruptions expel. Droplets of sulfuric acid that form when the gas combines with oxygen in the upper atmosphere can remain for many months, reflecting sunlight away from Earth and lowering temperatures. However, previous research had suggested that relatively minor eruptions -- those in the lower half of a scale used to rate volcano "explosivity" -- do not contribute much to this cooling phenomenon.
Now, new ground-, air- and satellite measurements show that small volcanic eruptions that occurred between 2000 and 2013 have deflected almost double the amount of solar radiation previously estimated. By knocking incoming solar energy back out into space, sulfuric acid particles from these recent eruptions could be responsible for decreasing global temperatures by 0.05 to 0.12 degrees Celsius (0.09 to 0.22 degrees Fahrenheit) since 2000, according to the new study accepted to Geophysical Research Letters, a journal of the American Geophysical Union.
These new data could help to explain why increases in global temperatures have slowed over the past 15 years, a period dubbed the 'global warming hiatus,' according to the study's authors.

The warmest year on record is 1998. After that, the steep climb in global temperatures observed over the 20th century appeared to level off. Scientists previously suggested that weak solar activity or heat uptake by the oceans could be responsible for this lull in temperature increases, but only recently have they thought minor volcanic eruptions might be a factor.
Climate projections typically don't include the effect of volcanic eruptions, as these events are nearly impossible to predict, according to Alan Robock, a climatologist at Rutgers University in New Brunswick, N.J., who was not involved in the study. Only large eruptions on the scale of the cataclysmic 1991 Mount Pinatubo eruption in the Philippines, which ejected an estimated 20 million metric tons (44 billion pounds) of sulfur, were thought to impact global climate. But according to David Ridley, an atmospheric scientist at the Massachusetts Institute of Technology in Cambridge and lead author of the new study, classic climate models weren't adding up.
"The prediction of global temperature from the [latest] models indicated continuing strong warming post-2000, when in reality the rate of warming has slowed," said Ridley. That meant to him that a piece of the puzzle was missing, and he found it at the intersection of two atmospheric layers, the stratosphere and the troposphere- the lowest layer of the atmosphere, where all weather takes place. Those layers meet between 10 and 15 kilometers (six to nine miles) above the Earth.

Traditionally, scientists have used satellites to measure sulfuric acid droplets and other fine, suspended particles, or aerosols, that erupting volcanoes spew into the stratosphere. But ordinary water-vapor clouds in the troposphere can foil data collection below 15 km, Ridley said. "The satellite data does a great job of monitoring the particles above 15 km, which is fine in the tropics. However, towards the poles we are missing more and more of the particles residing in the lower stratosphere that can reach down to 10 km."

To get around this, the new study combined observations from ground-, air- and space-based instruments to better observe aerosols in the lower portion of the stratosphere.
Four lidar systems measured laser light bouncing off aerosols to estimate the particles' stratospheric concentrations, while a balloon-borne particle counter and satellite datasets provided cross-checks on the lidar measurements. A global network of ground-based sun-photometers, called AERONET, also detected aerosols by measuring the intensity of sunlight reaching the instruments. Together, these observing systems provided a more complete picture of the total amount of aerosols in the stratosphere, according to the study authors.
Including these new observations in a simple climate model, the researchers found that volcanic eruptions reduced the incoming solar power by -0.19 ± 0.09 watts of sunlight per square meter of the Earth's surface during the 'global warming hiatus', enough to lower global surface temperatures by 0.05 to 0.12 degrees Celsius (0.09 to 0.22 degrees Fahrenheit). By contrast, other studies have shown that the 1991 Mount Pinatubo eruption warded off about three to five watts per square meter at its peak, but tapered off to background levels in the years following the eruption. The shading from Pinatubo corresponded to a global temperature drop of 0.5 degrees Celsius (0.9 degrees Fahrenheit).
Robock said the new research provides evidence that there may be more aerosols in the atmosphere than previously thought. "This is part of the story about what has been driving climate change for the past 15 years," he said. "It's the best analysis we've had of the effects of a lot of small volcanic eruptions on climate."

Ridley said he hopes the new data will make their way into climate models and help explain some of the inconsistencies that climate scientists have noted between the models and what is being observed.

Robock cautioned, however, that the ground-based AERONET instruments that the researchers used were developed to measure aerosols in the troposphere, not the stratosphere. To build the best climate models, he said, a more robust monitoring system for stratospheric aerosols will need to be developed.

Source; American Geophysical Union

Protect the world's deltas, experts urge

Written By Unknown on Saturday, December 20, 2014 | 7:24 PM

A catastrophic landslide, one of the largest known on the surface of the Earth, took place within minutes in southwestern Utah more than 21 million years ago. Credit: Image courtesy of Kent State University
A catastrophic landslide, one of the largest known on the surface of the Earth, took place within minutes in southwestern Utah more than 21 million years ago, reports a Kent State University geologist in a paper published in the November issue of the journal Geology.

The Markagunt gravity slide, the size of three Ohio counties, is one of the two largest known continental landslides (larger slides exist on the ocean floors). David Hacker, Ph.D., associate professor of geology at Kent State University at Trumbull, and two colleagues discovered and mapped the scope of the Markagunt slide over the past two summers.
His colleagues and co-authors are Robert F. Biek of the Utah Geological Survey and Peter D. Rowley of Geologic Mapping Inc. of New Harmony, Utah.

Geologists had known about smaller portions of the Markagunt slide before the recent mapping showed its enormous extent. Hiking through the wilderness areas of the Dixie National Forest and Bureau of Land Management land, Hacker identified features showing that the Markagunt landslide was much bigger than previously known.

The landslide took place in an area between what is now Bryce Canyon National Park and the town of Beaver, Utah. It covered about 1,300 square miles, an area as big as Ohio's Cuyahoga, Portage and Summit counties combined.

Its rival in size, the "Heart Mountain slide," which took place around 50 million years ago in northwest Wyoming, was discovered in the 1940s and is a classic feature in geology textbooks.

The Markagunt could prove to be much larger than the Heart Mountain slide, once it is mapped in greater detail.
"Large-scale catastrophic collapses of volcanic fields such as these are rare but represent the largest known landslides on the surface of the Earth," the authors wrote. The length of the landslide -- over 55 miles -- also shows that it was as fast moving as it was massive, Hacker said.
Evidence showing that the slide was catastrophic -- occurring within minutes -- included the presence of pseudotachylytes, rocks that were melted into glass by the immense friction. Any animals living in its path would have been quickly overrun. Evidence of the slide is not readily apparent to visitors today. "Looking at it, you wouldn't even recognize it as a landslide," Hacker said.

But internal features of the slide, exposed in outcrops, yielded evidence such as jigsaw puzzle rock fractures and shear zones, along with the pseudotachylytes.

Hacker, who studies catastrophic geological events, said the slide originated when a volcanic field consisting of many strato-volcanoes, a type similar to Mount St. Helens in the Cascade Mountains, which erupted in 1980, collapsed and produced the massive landslide.

The collapse may have been caused by the vertical inflation of deeper magma chambers that fed the volcanoes. Hacker has spent many summers in Utah mapping geologic features of the Pine Valley Mountains south of the Markagunt where he has found evidence of similar, but smaller slides from magma intrusions called laccoliths.

What is learned about the mega-landslide could help geologists better understand these extreme types of events. The Markagunt and the Heart Mountain slides document for the first time how large portions of ancient volcanic fields have collapsed, Hacker said, representing "a new class of hazards in volcanic fields."

While the Markagunt landslide was a rare event, it shows the magnitude of what could happen in modern volcanic fields like the Cascades.

"We study events from the geologic past to better understand what could happen in the future," he said. The next steps in the research, conducted with his co-authors on the Geology paper, will be to continue mapping the slide, collect samples from the base for structural analysis and date the pseudotachylytes.

Hacker, who earned his Ph.D. in geology at Kent State, joined the faculty in 2000 after working for an environmental consulting company. He is co-author of the book Earth's Natural Hazards: Understanding Natural Disasters and Catastrophes, published in 2010.

Permafrost soil: Possible source of abrupt rise in greenhouse gases at end of last ice age

Pleistocene Ice Complex cliff: 35 meters high Pleistocene Ice Complex cliff at Sobo Sise Island (Lena Delta), Siberian Arctic. Credit: Alfred-Wegener-Institut / Thomas Opel
Scientists from the Alfred Wegener Institute, Helmholtz Centre for Polar and Marine Research (AWI) have identified a possible source of carbon dioxide (CO2) and other greenhouse gases that were abruptly released to the atmosphere in large quantities around 14,600 years ago. According to this new interpretation, the CO2 -- released during the onset of the Bรธlling/Allerรธd warm period -- presumably had their origin in thawing Arctic permafrost soil and amplified the initial warming through positive feedback. The study now appears online in the journal Nature Communications.
One of the most abrupt rises in the carbon dioxide concentration in the atmosphere at the end of the last ice age took place about 14,600 years ago. Ice core data show that the CO2 concentration at that time increased by more than 10 ppm (parts per million, unit of measure for the composition of gases) within 200 years. This CO2 increase, i.e. approx. 0.05 ppm per year, was significantly less than the current rise in atmospheric CO2 of 2-3 ppm in the last decade caused by fossil fuels. These data describe an abrupt change in the global carbon cycle during the transition from the last ice age to the present-day warm interglacial and allow conclusions to be drawn about similar processes that could play a role in the future.
To determine the origin of the greenhouse gas, a team around by the geoscientists and climate researchers Dr. Peter Kรถhler and Dr. Gregor Knorr from the Alfred Wegener Institute has carried out computer simulations focusing on the new interpretation of these CO2 data. These calculations were motivated by new radiocarbon data (14C) that provide information on the age of the CO2 released to the atmosphere. The age of the carbon then allows conclusions to be drawn about the carbon source.

"The virtual lack of radiocarbon in the CO2 that was released into the atmosphere shows us that the carbon must have been very old," says Kรถhler. The carbon therefore cannot be originated from the deep ocean, Kรถhler adds: "The carbon stored in the deep ocean has been subject to exchange with the atmosphere over a period of millennia. In the atmosphere 14C has its only source. It is produced through the impact of galactic cosmic rays on molecules in the atmosphere." However, radiocarbon is unstable and decays with a half-life of around 5,700 years. The atmospheric data of CO2 and 14C can only be explained if a carbon source is assumed that contains virtually no 14C any more -- thus the greenhouse gases must have had another source than the deep ocean.

Permafrost soil contains, to some extent, very old organic material, which is released in the form of the greenhouse gases CO2 and methane when the soil thaws. Permafrost soil thus might be a possible source of old carbon. The thawing of Arctic permafrost soil might have been caused by a sudden resumption of large-scale Atlantic heat transport in the ocean that initiated the Bรธlling/Allerรธd warm period in the high northern hemisphere.

The scientists were able to estimate the amount of the carbon dioxide released to the atmosphere by applying a computer model that simulates the global carbon cycle. The simulation results indicate that the input of more than half a gigaton of carbon per year (1 gigaton = 1 petagram) over a period of two centuries is necessary to explain the observed data. This corresponds to a total amount of more than 100 gigatons of carbon. Present-day anthropogenic CO2 emissions due to fossil fuels, at approx. ten gigatons of carbon a year, are greater than the release rates of this natural process by a factor of at least ten.

According to the study, the proposed thawing of large areas of permafrost, followed by the rise in greenhouse gases, occurred at the same time as the warming in the northern hemisphere at the beginning of the Bรธlling warm period. The released greenhouse gases may amplify the initial warming through feedback effects.

A similar effect is also predicted for the future in the current IPCC report. Warming in Siberia, for instance, is already leading to thawing of permafrost soil: outgassing of CO2 and methane takes place. The same processes observed today -- and are expected to an even greater extent in the coming decades -- presumably occurred in a similar manner 14,600 years ago. "However, the state of the climate on Earth today has already been changed by anthropogenically emitted greenhouse gases. Future CO2 release due to the proposed thawing of permafrost will be substantially less than the input due to fossil fuels. However, these emissions from permafrost soil are additional greenhouse gas sources that further amplify the anthropogenically induced effect," says Kรถhler.

Groundwater patches play important role in forest health, water quality

Written By Unknown on Thursday, December 18, 2014 | 5:00 AM

This is Kevin McGuire, associate director of the Virginia Water Resources Research Center. Credit: Virginia Tech
Even during summer dry spells, some isolated patches of soil in forested watersheds remain waterlogged.

These patches act as hot spots of microbial activity that remove nitrogen from groundwater and return it to the atmosphere, researchers from several institutions, including Virginia Tech, report in a leading scientific journal.

The discovery provides insight into the health of a forest. Nitrogen is an important nutrient for plant growth and productivity, but in streams, it can be a pollutant.

"The importance of these fragmented patches of saturated soil and their role in the fate of nitrogen in forested watersheds has been underappreciated until recently," said Kevin McGuire, an associate director of the Virginia Water Resources Research Center based in Virginia Tech's College of Natural Resources and Environment, co-author of the article to be published in the Proceedings of the National Academy of Sciences.

"We were able to determine the importance of denitrification in patches of shallow groundwater, which have largely been overlooked control points for nitrogen loss from temperate forested watersheds," McGuire said.

Most nitrogen is deposited by rain. Temperate forests receive much larger inputs of nitrogen from the atmosphere than they export to streams. Once nitrogen leaves the forest in streams, it can become a water pollutant.

"In some ecosystems, there have been long-term declines in stream water export of nitrogen when inputs have remained elevated," said co-author Christine Goodale, an associate professor of ecology and evolutionary biology at Cornell University.

"Understanding the fate of this nitrogen has been a challenge because denitrification -- a gaseous loss of nitrogen to the atmosphere -- is notoriously difficult to measure," said co-author Peter Groffman, an expert on denitrification at the Cary Institute of Ecosystem Studies.

Denitrification removes nitrogen from water and can therefore improve water quality in downstream lakes and estuaries.

However, nitrogen is also an important nutrient for plant growth in the forest so removals of nitrogen by natural processes can reduce the productivity of the forest.
The research, led by Sarah Wexler while she was a postdoctoral associate in hydrology and stable isotope geochemistry at Cornell University, took place in the Hubbard Brook Experimental Forest in the White Mountains of New Hampshire, where the atmosphere annually deposits five to seven pounds of nitrogen per acre.

The Hubbard Brook Experimental Forest is part of the National Science Foundation's Long Term Ecological Research Network.

McGuire, also an associate professor of hydrology in the Department of Forest Resources and Environmental Conservation, led another National Science Foundation-funded project at the site, which developed an organizing framework to describe and map variations of soil in the watershed that explain shallow groundwater occurrence and frequency.
Groundwater wells from this earlier study were used in the new research to monitor soils that may have had the right conditions to function as hot spots for denitrification.

At sites throughout the forest, the research team measured the presence of nitrate, a form of nitrogen that is highly mobile and reactive in the environment, determined whether the nitrate is a result of atmospheric deposition or microbial conversion, and discovered the nitrogen loss to the atmosphere.

"We were able to differentiate sources of nitrate and show that some of the nitrate was lost to the atmosphere by looking at nitrate at the atomic level, that is, at the isotopic composition of the nitrogen and oxygen in nitrate," said Wexler, who is now at the School of Environmental Sciences at the University of East Anglia in the United Kingdom. "The isotopic composition of nitrate provides a natural way to directly track the details of nitrogen cycling."

McGurie said, "Some work remains to be done, but the aim is to be able to develop a better sense of where and how nitrogen is processed in the environment and be in a position to predict how changes in climate, for example warmer and wetter conditions, affect nitrogen cycling and water quality in forested ecosystems."

SourceVirginia Tech

Losing air: Barrage of small impacts likely erased much of the Earth’s primordial atmosphere

Today's atmosphere likely bears little trace of its primordial self: Geochemical evidence suggests that Earth's atmosphere may have been completely obliterated at least twice since its formation more than 4 billion years ago. Credit: Image courtesy of NASA
Today's atmosphere likely bears little trace of its primordial self: Geochemical evidence suggests that Earth's atmosphere may have been completely obliterated at least twice since its formation more than 4 billion years ago. However, it's unclear what interplanetary forces could have driven such a dramatic loss.

Now researchers at MIT, Hebrew University, and Caltech have landed on a likely scenario: A relentless blitz of small space rocks, or planetesimals, may have bombarded Earth around the time the moon was formed, kicking up clouds of gas with enough force to permanently eject small portions of the atmosphere into space.

Tens of thousands of such small impacts, the researchers calculate, could efficiently jettison Earth's entire primordial atmosphere. Such impacts may have also blasted other planets, and even peeled away the atmospheres of Venus and Mars.

In fact, the researchers found that small planetesimals may be much more effective than giant impactors in driving atmospheric loss. Based on their calculations, it would take a giant impact -- almost as massive as Earth slamming into itself -- to disperse most of the atmosphere. But taken together, many small impacts would have the same effect, at a tiny fraction of the mass.

Hilke Schlichting, an assistant professor in MIT's Department of Earth, Atmospheric and Planetary Sciences, says understanding the drivers of Earth's ancient atmosphere may help scientists to identify the early planetary conditions that encouraged life to form.
"[This finding] sets a very different initial condition for what the early Earth's atmosphere was most likely like," Schlichting says. "It gives us a new starting point for trying to understand what was the composition of the atmosphere, and what were the conditions for developing life."

Schlichting and her colleagues have published their results in the journal Icarus.
Efficient ejection

The group examined how much atmosphere was retained and lost following impacts with giant, Mars-sized and larger bodies and with smaller impactors measuring 25 kilometers or less -- space rocks equivalent to those whizzing around the asteroid belt today.

The team performed numerical analyses, calculating the force generated by a given impacting mass at a certain velocity, and the resulting loss of atmospheric gases. A collision with an impactor as massive as Mars, the researchers found, would generate a shockwave through Earth's interior, setting off significant ground motion -- similar to simultaneous giant earthquakes around the planet -- whose force would ripple out into the atmosphere, a process that could potentially eject a significant fraction, if not all, of the planet's atmosphere.

However, if such a giant collision occurred, it should also melt everything within the planet, turning its interior into a homogenous slurry. Given the diversity of noble gases like helium-3 deep inside Earth today, the researchers concluded that it is unlikely that such a giant, core-melting impact occurred.

Instead, the team calculated the effects of much smaller impactors on Earth's atmosphere. Such space rocks, upon impact, would generate an explosion of sorts, releasing a plume of debris and gas. The largest of these impactors would be forceful enough to eject all gas from the atmosphere immediately above the impact's tangent plane -- the line perpendicular to the impactor's trajectory. Only a fraction of this atmosphere would be lost following smaller impacts.

To completely eject all of Earth's atmosphere, the team estimated, the planet would need to have been bombarded by tens of thousands of small impactors -- a scenario that likely did occur 4.5 billion years ago, during a time when the moon was formed. This period was one of galactic chaos, as hundreds of thousands of space rocks whirled around the solar system, frequently colliding to form the planets, the moon, and other bodies.

"For sure, we did have all these smaller impactors back then," Schlichting says. "One small impact cannot get rid of most of the atmosphere, but collectively, they're much more efficient than giant impacts, and could easily eject all the Earth's atmosphere."

Runaway effect
However, Schlichting realized that the sum effect of small impacts may be too efficient at driving atmospheric loss. Other scientists have measured the atmospheric composition of Earth compared with Venus and Mars. These measurements have revealed that while each planetary atmosphere has similar patterns of noble gas abundance, the budget for Venus is similar to that of chondrites -- stony meteorites that are primordial leftovers of the early solar system. Compared with Venus, Earth's noble gas budget has been depleted 100-fold.
Schlichting realized that if both planets were exposed to the same blitz of small impactors, Venus' atmosphere should have been similarly depleted. She and her colleagues went back over the small-impactor scenario, examining the effects of atmospheric loss in more detail, to try and account for the difference between the two planets' atmospheres.

Based on further calculations, the team identified an interesting effect: Once half a planet's atmosphere has been lost, it becomes much easier for small impactors to eject the rest of the gas. The researchers calculated that Venus' atmosphere would only have to start out slightly more massive than Earth's in order for small impactors to erode the first half of the Earth's atmosphere, while keeping Venus' intact. From that point, Schlichting describes the phenomenon as a "runaway process -- once you manage to get rid of the first half, the second half is even easier."

Time zero
During the course of the group's research, an inevitable question arose: What eventually replaced Earth's atmosphere? Upon further calculations, Schlichting and her team found the same impactors that ejected gas also may have introduced new gases, or volatiles.

"When an impact happens, it melts the planetesimal, and its volatiles can go into the atmosphere," Schlichting says. "They not only can deplete, but replenish part of the atmosphere."

The group calculated the amount of volatiles that may be released by a rock of a given composition and mass, and found that a significant portion of the atmosphere may have been replenished by the impact of tens of thousands of space rocks.

"Our numbers are realistic, given what we know about the volatile content of the different rocks we have," Schlichting notes.

Jay Melosh, a professor of earth, atmospheric, and planetary sciences at Purdue University, says Schlichting's conclusion is a surprising one, as most scientists have assumed Earth's atmosphere was obliterated by a single, giant impact. Other theories, he says, invoke a strong flux of ultraviolet radiation from the sun, as well as an "unusually active solar wind."
"How the Earth lost its primordial atmosphere has been a longstanding problem, and this paper goes a long way toward solving this enigma," says Melosh, who did not contribute to the research. "Life got started on Earth about this time, and so answering the question about how the atmosphere was lost tells us about what might have kicked off the origin of life."
Going forward, Schlichting hopes to examine more closely the conditions underlying Earth's early formation, including the interplay between the release of volatiles from small impactors and from Earth's ancient magma ocean.

"We want to connect these geophysical processes to determine what was the most likely composition of the atmosphere at time zero, when the Earth just formed, and hopefully identify conditions for the evolution of life," Schlichting says.

Source:  Massachusetts Institute of Technology

Water vapor on Rosetta's target comet significantly different from that found on Earth

First measurements of comet’s water ratio. Credit: Copyright Spacecraft: ESA/ATG medialab; Comet: ESA/Rosetta/NavCam; Data: Altwegg et al. 2014
ESA's Rosetta spacecraft has found the water vapour from its target comet to be significantly different to that found on Earth. The discovery fuels the debate on the origin of our planet's oceans.

The measurements were made in the month following the spacecraft's arrival at Comet 67P/Churyumov-Gerasimenko on 6 August. It is one of the most anticipated early results of the mission, because the origin of Earth's water is still an open question.

One of the leading hypotheses on Earth's formation is that it was so hot when it formed 4.6 billion years ago that any original water content should have boiled off. But, today, two thirds of the surface is covered in water, so where did it come from?
In this scenario, it should have been delivered after our planet had cooled down, most likely from collisions with comets and asteroids. The relative contribution of each class of object to our planet's water supply is, however, still debated.

The key to determining where the water originated is in its 'flavour', in this case the proportion of deuterium -- a form of hydrogen with an additional neutron -- to normal hydrogen.

This proportion is an important indicator of the formation and early evolution of the Solar System, with theoretical simulations showing that it should change with distance from the Sun and with time in the first few million years.

One key goal is to compare the value for different kinds of object with that measured for Earth's oceans, in order to determine how much each type of object may have contributed to Earth's water.

Comets in particular are unique tools for probing the early Solar System: they harbour material left over from the protoplanetary disc out of which the planets formed, and therefore should reflect the primordial composition of their places of origin.

But thanks to the dynamics of the early Solar System, this is not a straightforward process. Long-period comets that hail from the distant Oort cloud originally formed in Uranus-Neptune region, far enough from the Sun that water ice could survive.

They were later scattered to the Solar System's far outer reaches as a result of gravitational interactions with the gas giant planets as they settled in their orbits.

Conversely, Jupiter-family comets like Rosetta's comet were thought to have formed further out, in the Kuiper Belt beyond Neptune. Occasionally these bodies are disrupted from this location and sent towards the inner Solar System, where their orbits become controlled by the gravitational influence of Jupiter.

Indeed, Rosetta's comet now travels around the Sun between the orbits of Earth and Mars at its closest and just beyond Jupiter at its furthest, with a period of about 6.5 years.
Previous measurements of the deuterium/hydrogen (D/H) ratio in other comets have shown a wide range of values. Of the 11 comets for which measurements have been made, it is only the Jupiter-family Comet 103P/Hartley 2 that was found to match the composition of Earth's water, in observations made by ESA's Herschel mission in 2011.

By contrast, meteorites originally hailing from asteroids in the Asteroid Belt also match the composition of Earth's water. Thus, despite the fact that asteroids have a much lower overall water content, impacts by a large number of them could still have resulted in Earth's oceans.
It is against this backdrop that Rosetta's investigations are important. Interestingly, the D/H ratio measured by the Rosetta Orbiter Spectrometer for Ion and Neutral Analysis, or ROSINA, is more than three times greater than for Earth's oceans and for its Jupiter-family companion, Comet Hartley 2. Indeed, it is even higher than measured for any Oort cloud comet as well.

"This surprising finding could indicate a diverse origin for the Jupiter-family comets -- perhaps they formed over a wider range of distances in the young Solar System than we previously thought," says Kathrin Altwegg, principal investigator for ROSINA and lead author of the paper reporting the results in the journal Science this week.
"Our finding also rules out the idea that Jupiter-family comets contain solely Earth ocean-like water, and adds weight to models that place more emphasis on asteroids as the main delivery mechanism for Earth's oceans."

"We knew that Rosetta's in situ analysis of this comet was always going to throw up surprises for the bigger picture of Solar System science, and this outstanding observation certainly adds fuel to the debate about the origin of Earth's water," says Matt Taylor, ESA's Rosetta project scientist.

"As Rosetta continues to follow the comet on its orbit around the Sun throughout next year, we'll be keeping a close watch on how it evolves and behaves, which will give us unique insight into the mysterious world of comets and their contribution to our understanding of the evolution of the Solar System."

Source: ESA
 
Support : Creating Website | Johny Template | Mas Template
Copyright © 2011. The planet wall - All Rights Reserved
Template Created by Easy Blogging Published by Mas Template
Proudly powered by Blogger