Latest Post
Showing posts with label GEOLOGY. Show all posts

The 500 million years ocean history

Written By Unknown on Monday, February 9, 2015 | 12:18 AM

Brachiopod Paraspirifer bownockeri from the Middle Devonian of Ohio (USA); Width: 5.6 cm. Picture: U. Jansen, Senckenberg Museum, Frankfurt am Main.

GEOMAR coordinates European research and education project BASE-LiNE Earth
02.03.2015 / Kiel. As the history of the oceans can be reconstructed in the past 500 million based on calcareous shells of fossil marine life, busy to date with the research project BASE-LiNE Earth. At the same time it enables talented young scientists and scientists a doctorate in an international research environment. The European Union supports the at GEOMAR Helmholtz Centre for Ocean Research Kiel coordinated project with a total of 3.8 million euros.

Almost all life on earth would be extinct - and that at least five times in the past 500 million years. The environmental changes that have each led to the mass extinction, the oceans play an important role in almost all cases. How did it happen that was phased so hostile to life as a life-giving force sea? And why have some species still survive? These are fundamental questions that will be examined in the next three years as part of the European research project BASE-LiNE Earth with innovative technologies and methods. In addition to answering the research questions BASE LiNE Earth serves as the training of talented young scholars and scientists who are recruited by means of a demanding selection process from all over the world and doctorate within the scope of the project. 

The EU promotes the GEOMAR Helmholtz Centre for Ocean Research Kiel coordinated project under a Marie Skłodowska-Curie Action in Horizon2020-Pogramm with a total of 3.8 million euros. The challenge for the future BASE-LiNE Earth-doctoral students, is to provide information to gain from distant epochs of earth's history. "When historians want to know about events 100 or 200 years ago, they visit libraries or archives where there is written evidence from these times," says project coordinator Prof. Dr. Anton Eisenhauer from GEOMAR. "We also use archives. 
However, they see something different. It is, for example, the calcareous shells of fossil brachiopods in which the relevant data on the chemical history of ocean water are stored reliably, "explains the Kiel geochemist on. 

The information is in the calcite shells of course not writing before, but encrypted in the chemical and mineralogical composition. "If we precise the ratios of elements such as strontium, magnesium, boron, or measure of the isotopic to each other, we can decrypt the information," says Professor Eisenhauer.

This then the age of the shell, as well as the chemical composition of the previous ocean and prevailing environmental conditions such as water temperature and the acidity of the water can be reconstructed. We know, for example, know that during the greatest mass extinction 251 million years ago, the ocean contained no oxygen and was acidified to a large extent. 

"This is similar to some scenarios that we expect for the future of our ocean," explains Professor Eisenhauer. Model calculations are carried out within the framework of the project should show how far the former changes in the environment are transferable to the present day. The challenge is to gain this information and to make it usable. In collaboration with industry partners modern analytical methods for obtaining information in cooperation with business partners in this area in the context of BASE-LiNE Earth therefore be generated and developed. The project involves a total of 21 scientific institutions from eight European countries and partners from Canada, Israel, Palestine and Australia involved. 15 PhD positions will announce the project this spring, two of them for the GEOMAR in Kiel. 

The Integrated School of Ocean Sciences (ISOS) provides at the University of Kiel for a comprehensive training program in which the scholars not only pursue their academic goals, but also learn more professional qualifications, skills and interact with each other.  In the coming years, the parties want to do their topic also by means of exhibitions and school supplies to a wider audience. "Of course we also bind the doctoral students, which thus also learn to communicate their work understandable," says the project coordinator. For more information on the project website www.baseline-earth.eu.

Source: Geomar

The role of gravitational instabilities in deposition of volcanic ash: The example of Eyjafjallajökull

Written By Unknown on Sunday, February 8, 2015 | 11:59 PM

 Volcanic ash poses a significant hazard
Figure 1 from Manzella et al.: Original and processed snapshot of the video of the Eyjafjallajökull (Iceland) plume as observed on 4 May 2010. White arrows indicate finger positions. This article is Open Access.

Boulder, Colo., USA – Volcanic ash poses a significant hazard for areas close to volcanoes and for aviation. For example, the 2010 eruption of Eyjafjallajökull, Iceland, clearly demonstrated that even small-to-moderate explosive eruptions, in particular if long-lasting, can paralyze entire sectors of societies, with significant, global-level, economic impacts. In this open-access Geology article, Irene Manzella and colleagues present the first quantitative description of the dynamics of gravitational instabilities and particle aggregation based on the 4 May 2010 eruption.

Their analysis also reveals some important shortcomings in the Volcanic Ash Transport and Dispersal Models (VATDMs) typically used to forecast the dispersal of volcanic ash. In particular, specific processes exist that challenge the view of sedimentation of fine particles from volcanic plumes and that are currently poorly understood: particle aggregation and gravitational instabilities. These appear as particle-rich "fingers" descending from the base of volcanic clouds and have commonly been observed during volcanic explosive eruptions.

Based on direct observations of the 2010 Eyjafjallajökull plume, on the correlation with the associated fallout deposit, and on dedicated laboratory analogue experiments, Irene Manzella and colleagues show how fine ash in these particle-rich fingers settles faster than individual particles and that aggregation and gravitational instabilities are closely related. Both phenomena can significantly contribute to reducing fine-ash lifetime in the atmosphere and, therefore, it is crucial to include them in VATDMs in order to provide accurate forecasting of ash dispersal and sedimentation.

Source: Gsa

Drilling Reveals Fault Rock Architecture in New Zealand’s Central Alpine Fault

Figure 1: Location map of study by Virginia Toy et al. Click on the image for a larger version.
            Figure 1: Location map of study by Virginia Toy et al. Image Credit: GSA
Boulder, Colo., USA - Rocks within plate boundary scale fault zones become fragmented and altered over the earthquake cycle. They both record and influence the earthquake process. In this new open-access study published in Lithosphere on 4 Feb., Virginia Toy and colleagues document fault rocks surrounding New Zealand's active Alpine Fault, which has very high probability of generating a magnitude 8 or greater earthquake in the near future.

Descriptions already suggest that the complex fault rock sequence results from slip at varying rates during multiple past earthquakes, and even sometimes during aseismic slip. They also characterize this fault before rupture; Toy and colleagues anticipate that repeat observations after the next event will provide a previously undescribed link between changes in fault rocks and the ground shaking response. They write that in the future this sort of data might allow realistic ground shaking predictions based on observations of other "dormant" faults.

The first phase of the Deep Fault Drilling Project (DFDP-1) yielded a continuous lithological transect through fault rock surrounding the Alpine fault (South Island, New Zealand). This allowed micrometer- to decimeter-scale variations in fault rock lithology and structure to be delineated on either side of two principal slip zones intersected by DFDP-1A and DFDP-1B. Here, we provide a comprehensive analysis of fault rock lithologies within 70 m of the Alpine fault based on analysis of hand specimens and detailed petrographic and petrologic analysis. The sequence of fault rock lithologies is consistent with that inferred previously from outcrop observations, but the continuous section afforded by DFDP-1 permits new insight into the spatial and genetic relationships between different lithologies and structures. We identify principal slip zone gouge, and cataclasite-series rocks, formed by multiple increments of shear deformation at up to coseismic slip rates. A 20−30-m-thick package of these rocks (including the principal slip zone) forms the fault core, which has accommodated most of the brittle shear displacement. 

This deformation has overprinted ultramylonites deformed mostly by grain-size-insensitive dislocation creep. Outside the fault core, ultramylonites contain low-displacement brittle fractures that are part of the fault damage zone. Fault rocks presently found in the hanging wall of the Alpine fault are inferred to have been derived from protoliths on both sides of the present-day principal slip zone, specifically the hanging-wall Alpine Schist and footwall Greenland Group. This implies that, at seismogenic depths, the Alpine fault is either a single zone of focused brittle shear that moves laterally over time, or it consists of multiple strands. Ultramylonites, cataclasites, and fault gouge represent distinct zones into which deformation has localized, but within the brittle regime, particularly, it is not clear whether this localization accompanies reductions in pressure and temperature during exhumation or whether it occurs throughout the seismogenic regime. These two contrasting possibilities should be a focus of future studies of fault zone architecture.

Source:GSA

A Long dry spell doomed Mexican city 1,000 years ago

Written By Unknown on Saturday, February 7, 2015 | 8:32 AM

A Long dry spell doomed Mexican city 1,000 years ago
Ruins of the city of Cantona in the Mexican state of Puebla, with the mountain Cerro Pizarro in the background. The city was abandoned almost 1,000 years ago, probably as a result of a prolonged dry spell. (Ines Urdaneta image courtesy of Wikimedia Commons.)

A UC Berkeley study sheds new light on this question, providing evidence that a prolonged period of below-average rainfall was partly responsible for the abandonment of one such city, Cantona, between A.D. 900 and A.D. 1050.

At its peak, Cantona, located in a dry, volcanic basin (La Cuenca Oriental) east of today’s Mexico City, was one of the largest cities in the New World, with 90,000 inhabitants. The area was a major source of obsidian, and the city may have played a military role alongside an important trade route from the Veracruz coast into the highlands.

To assess the climate in that area before and after Cantona’s collapse, UC Berkeley geographers analyzed sediment cores from a lake located 20 miles south of the former city. They found evidence of a 650-year period of frequent droughts that extended from around A.D. 500 to about A.D. 1150. This was part of a long-term drying trend in highland Mexico that started 2,200 years ago, around 200 B.C. The climate became wetter again in about A.D. 1300, just prior to the rise of the Aztec empire.

“The decline of Cantona occurred during this dry interval, and we conclude that climate change probably played a role, at least towards the end of the city’s existence,” said lead author Tripti Bhattacharya, a UC Berkeley graduate student.

Surprisingly, the population of Cantona increased during the early part of the dry period, perhaps because of political upheaval elsewhere that increased the importance of the heavily fortified city, she said. Teotihuacan, less than 100 miles to the west, was in decline at the time, also possibly because of more frequent droughts. 
Lake Aljojuca, Mexico
The maar lake Aljojuca, 20 miles south of Cantona, yielded sediments that recorded a lengthy series of droughts between A.D. 500 and 1150. (Tripti Bhattacharya photo)

“In a sense the area became important because of the increased frequency of drought,” said UC Berkeley associate professor of geography Roger Byrne. “But when the droughts continued on such a scale, the subsistence base for the whole area changed and people just had to leave. The city was abandoned.”

Bhattacharya, Byrne and their colleagues report their findings in an article appearing this week in the early edition of the journal Proceedings of the National Academy of Sciences. The UC Berkeley researchers analyzed lake cores provided by scientists at the National Autonomous University of Mexico in Juriquilla, Querétaro, Mexico and the German Research Centre for Geosciences in Potsdam, Germany.

Political upheaval and climate change

Byrne emphasized that the area’s typical monsoon weather with wet summers and dry winters did not stop, but was interrupted by frequent short-term droughts, no doubt affecting crops and water supplies. Today the area is close to the northern limit of maize production without irrigation, and would have been particularly vulnerable to drier conditions, he said.

Byrne, a member of the Berkeley Initiative on Global Change Biology (BiGCB) and curator of fossil pollen in the Museum of Paleontology, has studied sediment cores from many lakes in Mexico and California, and is particularly interested in possible links between climate change and human activities.

Nearly 20 years ago, he learned of Cantona and traveled with students to the areas three times to obtain cores from lakes near the site, most of which are maar lakes created by magma explosions. They are deep and often contain undisturbed and regularly layered sediments ideal for chronological studies.
Tripti Bhattacharya
Tripti Bhattacharya
Tripti Bhattacharya analyzed carbonates in lake sediments to explore the climate history of the Cuenca Oriental east of Mexico City. (Ellie Broadman photo)

German colleagues cored this particular lake, Aljojuca, in 2007, and Bhattacharya traveled to Potsdam to collect sediment samples. Oxygen isotope ratios in carbonate sediments are correlated with the ratio of precipitation to evaporation and thus indicate aridity. Organic material in the sediments was used for accelerator mass spectroscopy carbon-14 dating.

“We can show that both the growth and decline of the site took place during a time period of frequent drought, which forces us to think in more nuanced ways about how political and social factors interact with environmental factors to cause social and cultural change,” Bhattacharya said. “That makes the study particularly interesting.”

Bhattacharya noted that more studies are necessary to reconstruct the prehistoric climate of highland Mexico. Such studies could reveal the causes of prehistoric climatic change and whether they were similar to the factors that regulate the region’s climate today, such as the El Niño/Southern Oscillation.

Co-authors include Harald Böhnel and Kurt Wogau of UNAM, Juriquilla; Ulrike Kienel of the German Research Center for Geosciences in Potsdam; B. Lynn Ingram of UC Berkeley; and Susan Zimmerman of Lawrence Livermore National Laboratory. The work was funded by the National Science Foundation.

Source: UC Berkeley

NOAA’s investments in weather models and partnerships paying off

Written By Unknown on Tuesday, February 3, 2015 | 2:24 AM

Early improvements effective in forecasting recent Nor’easter; future forecast model upgrades planned
As the Northeast digs out from this week’s blizzard, a new NOAA-led effort to improve the forecasting of such high impact weather events is reaching an important early benchmark. One of the first major improvements - upgrading the resolution of three global forecast models -- has already shown its effectiveness. One of these models, the newly upgraded Global Forecast System (GFS) model, provided one of the most precise forecasts of the track, intensity, precipitation, and distribution of the Nor’easter. The other research models provided important forecast information, as well.

“The Global Forecast System did remarkably well in the recent Nor’easter,” said Louis Uccellini, director of NOAA’s National Weather Service. “This is due to the recent improvements we’ve made to the GFS, including higher resolution, improved physics, and better access to new data. With the help of scientists at NOAA Research, we’re making improvements to all our models, and upgrading supercomputers to improve our ability to translate data into actionable information, and to produce more timely, accurate and reliable forecasts.”

By the end of January, the $13 million project called the High Impact Weather Prediction Project (HIWPP), funded by Congress in the wake of Hurricane Sandy, will have improved the resolution on the global forecast model operated by NOAA Research Earth System Research Laboratory and the model operated by the U.S. Navy.
Improving global models
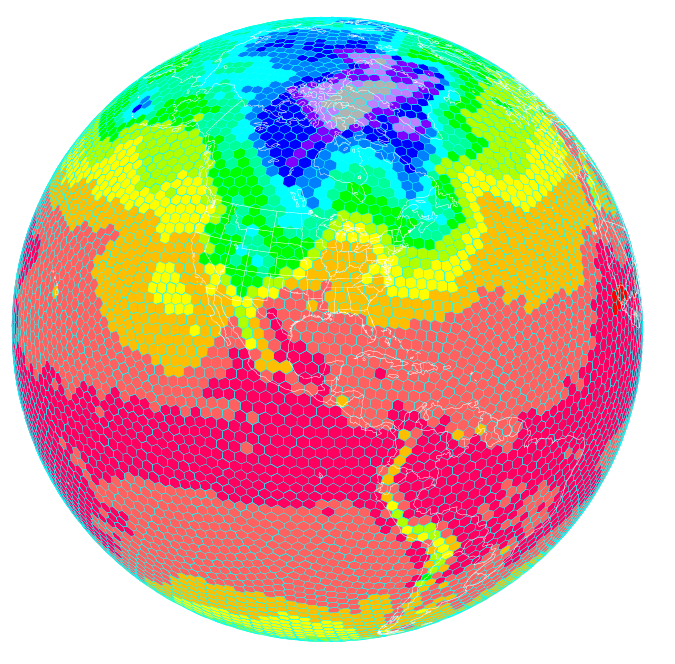
Scientists at NOAA’s Earth System Research Laboratory are running a high resolution global forecast model called the FIM, or Flow following finite volume Icoschedral Model. As depicted here, the FIM uses a unique grid that allows for a more uniform representation of the Earth. Higher resolution models are helping improve severe weather prediction. (NOAA)

In addition, NOAA researchers have written and installed programs to enable these three global models to work together effectively, which provides greater accuracy and confidence in forecasts. The third improvement is a plan to actively involve the broader weather forecasting community, including other public, academic and private sector scientists, in the evaluation of how these models work together to refine and improve forecasts.

“We are always looking for ways to improve the reliability and accuracy of our forecasts and models,” said John Cortinas, director of NOAA’s Office of Weather and Air Quality, who is overseeing HIWPP, which involves researchers from NOAA’s Oceanic and Atmospheric Research, NOAA’s National Weather Service, cooperative institutes, other government and academic partners.

“The goal of the project is to develop the next generation of weather forecast models that will eventually extend our ability to skillfully forecast high-impact weather out to several weeks and beyond,” Cortinas said. “By extending lead time for forecasts on storms like the one we’ve just experienced, cities and towns can better plan for these events, potentially saving lives and helping protect valuable land, homes and businesses. Businesses and industry can better plan everything from shipping to safe routing of air traffic to energy consumption. For ordinary citizens, it will be easier to plan an event or a trip.”

Over the last decades, weather forecasts have improved steadily so that we now have accurate forecasts out to five days, with reasonable accuracy to seven days. “We’ve gained about a day a decade in accuracy,” said Timothy Schneider, a research meteorologist at NOAA’s Earth System Research Laboratory, who is working to improve global forecast models. “Gaining a day of accuracy involves a combination of improving the science, adding computer power and increasing the necessary observations. With this project, we’re trying to accelerate this progress to make quicker gains.”

Global weather data key to improved local forecasts

“We know we can get better weather forecasts by improving the resolution of global forecast models so they depict weather in finer and finer detail,” explained Schneider. The resolution of NOAA’s two global forecast models has improved from grids that are 24 kilometers, to ones that are about 13 kilometers.  “The finer you chop up the picture, the more you can see of what is happening inside a particular storm. This helps us make better forecasts.”

 “If we’re going to predict weather out beyond seven and 10 days, we need even better global weather forecast models that show us what’s occurring on the other side of the Earth,” added Schneider. “Weather patterns on one side of the globe travel around the Earth and evolve. Storms born in the western Pacific follow air patterns that can create major winter storms on the West Coast, and weather patterns off the coast of Africa can spawn hurricanes in the U.S.”

Source: NOAA

Antarctic ozone hole similar to last year

The Antarctic ozone hole, which forms annually in the August to October period, reached its peak size on September 11, stretching to 9.3 million square miles (24.1 million square kilometers), roughly the same size as last year’s peak of 9.3 million square miles (24 million square kilometers) on September 16, 2013. This is an area similar in size to North America.

Ozone hole
This image, using NOAA satellite data, shows the ozone hole (areas below 220 Dobson units) in shades of red. (Credit: NOAA Visualization Lab; http://www.nnvl.noaa.gov/MediaDetail2.php?MediaID=1636&MediaTypeID=1)

In comparison, the largest ozone hole area recorded to date on a single day was on September 9, 2000, at 11.5 million square miles (29.9 million square kilometers). The ozone layer helps shield life on Earth from potentially harmful ultraviolet (UV) radiation that can cause skin cancer, damage plants and phytoplankton—the top of the oceanic food chain.

“The good news is that our measurements show less thinning of the ozone over the South Pole during the past three years,” said Bryan Johnson, a researcher with NOAA’s Earth System Research Laboratory in Boulder, Colorado. “However, the rate at which ozone thins during the month of September has remained about the same for the past two decades. A decrease in this rate will be an important sign of recovery.”

South Pole balloon-borne ozonesonde observations measured a minimum amount of 120 Dobson Units of ozone this year on September 29. Ozonesonde measurements of 250 Dobson Units in August are common just before the rapid destruction of ozone in September.  NOAA releases about 50-60 ozonesonde balloons per year since 1986 to measure the ozone layer at the South Pole.  Over the last 50 years satellite and ground-based records over Antarctica show ozone column amounts ranging from 100 to 400 Dobson units, which translates to about 1 millimeter (1/25 inch) to 4 millimeters (1/6 inch) of ozone in a layer if all of the ozone were brought down to the surface.

The Antarctic ozone hole began making a yearly appearance in the early 1980s, grew in size through the 1980s and has been consistently large since 1990, with annual variability attributed to stratospheric meteorological conditions over Antarctica. The hole is caused by chlorine released by manmade chemicals called chlorofluorocarbons or CFCs that were extensively used as aerosol sprays and in refrigerators.

Ozonesonde release
NOAA Corps LTJG Joseph Phillips releases an ozonesonde that's attached to a helium balloon. The instrument will rise 18 miles into the atmosphere to measure the thickness of ozone. (Credit: Chet Waggoner, NOAA)

These chlorine compounds lead to ozone depletion in certain upper atmospheric conditions. These conditions are at their peak over Antarctica as the dark cold winter gives way to the Antarctic spring in September. Just before the sun rises over Antarctica, extremely cold temperatures in the stratosphere allow for polar stratospheric clouds to form, a rare event in the earth’s atmosphere, but a regular occurrence in the winter over Antarctica. Chemical reactions on the cloud particles convert stable chlorine compounds into unstable or reactive forms. The sun light triggers reactive chlorine and ozone chemistry that depletes ozone in a large volume over Antarctica.

Scientists first made the connection that CFCs were depleting the earth’s protective layer in 1974. In 1987, 46 nations, including the U.S., signed the Montreal Protocol, a landmark agreement to phase out production of ozone-depleting chemicals. The slow recovery of this ozone layer is one of the great international efforts to restore the planet from manmade damage.

The 2014 level of ozone depleting substances over Antarctica has declined about 9 percent below the 2000 recorded maximum. But CFCs can remain in the atmosphere for more than 50 years. The ozone layer above Antarctica likely will not return to its 1980 state until about 2070, said Paul Newman, chief scientist for atmospheres at NASA’s Goddard Space Flight Center in Greenbelt, Maryland. Climate change may also affect the rate of ozone recovery by cooling the stratosphere, which can slow Antarctic ozone recovery.

“Year-to-year weather variability significantly impacts Antarctica ozone because warmer stratospheric temperatures can reduce ozone depletion,” said Paul A. Newman, chief scientist for atmospheres at NASA's Goddard Space Flight Center in Greenbelt, Maryland. “The ozone hole area is smaller than what we saw in the late-1990s and early 2000s, and we know that chorine levels are decreasing. However, we are still uncertain about whether a long-term Antarctic stratospheric temperature warming might be reducing this ozone depletion.”

Under the mandate of the Clean Air Act, NOAA and NASA scientists keep a close eye on the ozone layer’s health with satellite data, ground-based measurements and instruments sent up through the ozone layer via balloons. Together, these instruments provide a big picture of the thickness and area extent of the ozone hole. NOAA measures the thickness of the ozone using ground-based instruments and by sending balloons with measurement devices up 18 miles into the atmosphere from NOAA’s Antarctic station.

NOAA and NASA also use data taken by the Ozone Mapping Profiler Suite (OMPS) instrument on board the Suomi-National Polar-Orbiting Partnership satellite to monitor the earth’s ozone layer. This instrument replaced the NOAA Solar Backscatter UltraViolet/2 ozone profiler and NASA Total Ozone Mapping Spectrometer.  NOAA’s Climate Prediction Center has been monitoring the Earth’s ozone layer for over 30 years, analyzing ozone concentration at various altitudes in the ozone layer as well as the total column amount of ozone. These measurements provide a three dimensional perspective of the ozone layer. This provides the means to monitor the ozone layer’s health and to make sure it is on the road to recovery.

Source: NOAA

NOAA joins with Princeton and other institutions in six-year study to help public better understand Southern Ocean

Written By Unknown on Monday, February 2, 2015 | 8:49 PM

NOAA is one of 10 institutions working together on the Southern Ocean Carbon and Climate Observations and Modeling program, or SOCCOM, a six-year, $21 million initiative to improve our understanding of the importance and health of the Southern Ocean encircling Antarctica. (Image by Oscar Schofield, Rutgers University)

The Southern Ocean that encircles Antarctica lends a considerable hand in keeping Earth's temperature hospitable by soaking up half of the human-made carbon in the atmosphere and a majority of the planet's excess heat. Yet, the inner workings — and global importance — of this ocean that accounts for 30 percent of the world's ocean area remains relatively unknown to scientists, as observations remain hindered by dangerous seas.

NOAA is one of 10 institutions working together on the Southern Ocean Carbon and Climate Observations and Modeling program, or SOCCOM, a six-year, $21 million initiative to improve our understanding of the importance and health of the Southern Ocean encircling Antarctica. (Image by Oscar Schofield, Rutgers University)

Princeton University, NOAA and eight other partner institutions now seek to make the Southern Ocean better known scientifically and publicly through a $21 million program that will create a biogeochemical and physical portrait of the ocean using hundreds of robotic floats deployed around Antarctica and an expanded computational capacity. The Southern Ocean Carbon and Climate Observations and Modeling program, or SOCCOM, is a six-year initiative headquartered at Princeton and funded by the National Science Foundation’s Division of Polar Programs, with additional support from the NOAA and NASA. The U.S. Argo program, led by CPO's Steven Piotrowicz, will play a major role in the project. 

"The scarcity of observations in the Southern Ocean and inadequacy of earlier models, combined with its importance to the Earth's carbon and climate systems, means there is tremendous potential for groundbreaking research in this region," Sarmiento said.
Central to the program are roughly 200 floats outfitted with biogeochemical sensors that will provide almost continuous information related to the ocean's carbon, nutrient (nitrate, in particular) and oxygen content, both at and deep beneath the surface. The floats are augmented biogeochemical versions of the nearly 4,000 Argo floats deployed worldwide to measure ocean salinity and temperature. SOCCOM marks the first large-scale deployment of these biogeochemical floats.

"These floats are revolutionary and this major new observational initiative will give us unprecedented year-round coverage of biogeochemistry in the Southern Ocean," Sarmiento said.
The Southern Ocean research will involve using Argo type floats equipped with new sensors that measure pH, nitrates in addition to temperature and salinity. (NOAA)

The floats will increase the monthly data currently coming out of the Southern Ocean by 10 to 30 times, Sarmiento said. That data will be used to improve recently developed high-resolution earth-system models, which will allow for a better understanding of the Southern Ocean and for better projections of Earth’s climate and biogeochemical trajectory. In keeping with SOCCOM's knowledge sharing, or "broader impacts," component, all the information collected will be freely available to the public, researchers and industry.

SOCCOM will provide direct observations to further understand the importance of the Southern Ocean as suggested by models and ocean studies. Aside from carbon and heat uptake, models have indicated that the Southern Ocean delivers nutrients to lower-latitude surface waters that are critical to ocean ecosystems around the world. In addition, the impacts of ocean acidification as levels of carbon dioxide in atmosphere increase are projected to be most severe in the Southern Ocean.

Other than administering the project, Sarmiento and other Princeton researchers will co-lead the modeling and broader impacts components, as well as coordinated data management. Researchers from NOAA's Geophysical Fluid Dynamics Laboratory housed on Princeton's Forrestal Campus will carry out high-resolution earth-system simulations in support of the modeling effort, which is led by the University of Arizona and includes collaborators from the University of Miami.

The floats will be constructed at the University of Washington with sensors from the Monterey Bay Aquarium Research Institute; NOAA’s Climate Program Office will provide half of the basic Argo floats. Float deployment, observation analysis and data assimilation will be led by the Scripps Institution of Oceanography at the University of California-San Diego. Climate Central, a non-profit science and journalism organization based in Princeton, will oversee the broader-impacts component. Researchers from Oregon State University and NOAA will develop the floats’ carbon algorithms.

“The SOCCOM effort is the first systematic expansion of the US Argo program into biogeochemistry. The unique subsurface ocean observations from SOCCOM will contribute towards our efforts to observe the global oceans,” said David Legler, director of NOAA’s Climate Observations Division.

In addition, NASA will support a complementary project involving researchers at the University of Maine and Rutgers University that will equip the floats with bio-optical sensors intended to gather data about biological processes in the water column.

This web story was written by Morgan Kelly, science writer for Princeton University, and includes an additional quote from NOAA's David Legler

Source: NOAA

Atmospheric warming heats the bottom of ice sheets, as well as the top

Written By Unknown on Saturday, January 31, 2015 | 4:27 PM

A 70-meter-deep basin formed near the summit of Greenland’s Flade Isblink Ice Cap in the fall of 2012 when a lake 540 meters beneath the ice surface suddenly emptied. Summer meltwater streams on the ice cap surface (blue) enter crevasses near the bottom of the image. Photo Credit: WorldView-2 Imagery (c) 2014, DigitalGlobe, Inc.
University of Minnesota researchers are part of a national team of scientists that has published a new paper showing for the first time that meltwater from the surface of an ice cap in northeastern Greenland can make its way beneath the ice and become trapped, refilling a subglacial lake. This meltwater provides heat to the bottom of the ice sheet.

These groundbreaking findings provide new information about atmospheric warming and its affect on the critical zone at the base of the ice. The warmth provided by the water could make the ice sheet move faster and alter how it responds to the changing climate.

The research is detailed in a new paper published today online by the journal Nature. The research was led by Cornell University Earth and Atmospheric Sciences researcher Michael Willis, who is also an adjunct faculty member in the geological sciences department at UNC-Chapel Hill's College of Arts and Sciences. The research study’s co-authors are Bradley Herried, University of Minnesota School of Earth Science’s Polar Geospatial Center; Michael Bevis, Ohio State University School of Earth Sciences; and Robin Bell, Columbia University Lamont Doherty Earth Observatory.

“We’re seeing surface meltwater make its way to the base of the ice where it can get trapped and stored at the boundary between the bedrock beneath the ice sheet and the ice itself,” Willis said. “As the lake beneath the ice fills with surface meltwater, the heat released by this trapped meltwater can soften surrounding ice, which may eventually cause an increase in ice flow.”

The researchers were able to pinpoint when the subglacial lake refilled using data collected from high-resolution satellite images from the University of Minnesota’s Polar Geospatial Center, as well as data from NASA’s operation IceBridge for calibration and verification.

The direct link between the surface meltwater and the filling of a lake at the base of the ice has never been seen before. Over the last few years the number of lakes on the surface of the Greenland ice sheet has greatly increased. Surface lakes are also occurring much farther inland at higher altitudes than in the past. If this mechanism of transferring water and warmth from the surface lakes to the bottom of the ice sheet is common then the Greenland Ice Sheet is likely to respond more rapidly to climate change than is currently predicted.

The Greenland ice sheet comprises about 80 percent of the land mass of Greenland and previous studies have documented that the ice sheet is melting at a faster rate due to climate change. The movement of meltwater beneath the ice sheet, from the interior to the ocean, is the topic of many investigations as it can control the speed at which the ice sheet moves. This is the first study to document that surface water can penetrate to the bottom of an ice cap and be trapped in place. Researchers say this process could also occur at other large bodies of ice.

The study was sparked in 2012 when Willis was mapping ice changes around the edge of the Greenland Ice Sheet as part of a study funded by U.S. National Science Foundation (NSF) to understand how much of the accelerating ice loss in Greenland is caused by melting and how much is caused by the increase of ice moving into the ocean.

During his research, Willis spotted a 70-meter-deep hole (the equivalent of a 10-story building) that had formed when a subglacial lake, far beneath the ice surface, emptied in the late fall of 2011. Subglacial lakes are rare in Greenland, and the presence of such a lake in the far northeast came as a surprise. The ice in this region is much too slow, too cold and too thin to allow melting beneath the ice cap, which is how a subglacial lake usually forms. 

Between 2012 and 2014, Willis watched as summer meltwater on the surface of the ice made its way down cracks around the hole and refilled the empty lake basin at the base of the ice cap. When water was flowing on the surface, the subglacial lake filled. When water stopped flowing on the surface, the subglacial lake stopped refilling.

Each summer scientists see bright blue streams form on the surface of Greenland as warm air melts the ice sheet. What happens to this water when it disappears into cracks in the ice has remained a mystery.

“This discovery that water can be stored in lakes beneath the ice shows how the plumbing on the surface is linked to the plumbing at the base," said co-author Bell.

The Cornell-led team calculated that the lake beneath the ice has filled about half way since its 2011 blowout that originally drove water from the lake at a volume of 215 cubic meters per second (nearly 57,000 gallons—close to the volume of a 30-foot-by-50-foot backyard swimming pool every second.)  As the lake refills, the surface meltwater carries stored heat, called latent heat, along with it from the relatively warm atmosphere to the icy depths. This latent heat reduces the stiffness of the surrounding ice and makes the ice more likely to flow out to sea.

Even though researchers have long known of the existence of subglacial lakes, never before have they witnessed any refilling from the surface. The refilling signals to researchers that Greenland’s ice loss has likely reached a milestone.

"We can actually see the meltwater pour down into these holes and then watch these subglacial lakes drain out and fill up again in real time,” said study co-author Bevis. “With melting like that, even the deep interior of the ice sheet is going to change. If enough water is pouring down into the Greenland Ice Sheet for us to see the same subglacial lake empty and refill itself over and over, then there must be so much latent heat being released under the ice that we’d have to expect it to change the large-scale behavior of the ice sheet.”

Source: University of Minnesota

Cassini Catches Titan Naked in the Solar Wind

This diagram depicts conditions observed by NASA's Cassini spacecraft during a flyby in Dec. 2013, when Saturn's magnetosphere was highly compressed, exposing Titan to the full force of the solar wind. Image credit: NASA/JPL-Caltech
Researchers studying data from NASA's Cassini mission have observed that Saturn's largest moon, Titan, behaves much like Venus, Mars or a comet when exposed to the raw power of the solar wind. The observations suggest that unmagnetized bodies like Titan might interact with the solar wind in the same basic ways, regardless of their nature or distance from the sun.

Titan is large enough that it could be considered a planet if it orbited the sun on its own, and a flyby of the giant moon in Dec. 2013 simulated that scenario, from Cassini's vantage point. The encounter was unique within Cassini's mission, as it was the only time the spacecraft has observed Titan in a pristine state, outside the region of space dominated by Saturn's magnetic field, called its magnetosphere.

"We observed that Titan interacts with the solar wind very much like Mars, if you moved it to the distance of Saturn," said Cesar Bertucci of the Institute of Astronomy and Space Physics in Buenos Aires, who led the research with colleagues from the Cassini mission. "We thought Titan in this state would look different. We certainly were surprised," he said.

The solar wind is a fast-flowing gale of charged particles that continually streams outward from the sun, flowing around the planets like islands in a river. Studying the effects of the solar wind at other planets helps scientists understand how the sun's activity affects their atmospheres. These effects can include modification of an atmosphere's chemistry as well as its gradual loss to space.

Titan spends about 95 percent of the time within Saturn's magnetosphere. But during a Cassini flyby on Dec. 1, 2013, the giant moon happened to be on the sunward side of Saturn when a powerful outburst of solar activity reached the planet. The strong surge in the solar wind so compressed the sun-facing side of Saturn's magnetosphere that the bubble's outer edge was pushed inside the orbit of Titan. This left the moon exposed to, and unprotected from, the raging stream of energetic solar particles.

Using its magnetometer instrument, which is akin to an equisitely sensitive compass, Cassini has observed Titan many times during the mission's decade in the Saturn system, but always within Saturn's magnetosphere. The spacecraft has not been able to detect a magnetic field coming from Titan itself. In its usual state, Titan is cloaked in Saturn's magnetic field.

This time the influence of Saturn was not present, allowing Cassini's magnetometer to observe Titan as it interacted directly with the solar wind. The special circumstance allowed Bertucci and colleagues to study the shockwave that formed around Titan where the full-force solar wind rammed into the moon's atmosphere.

At Earth, our planet's powerful magnetic field acts as a shield against the solar wind, helping to protect our atmosphere from being stripped away. In the case of Venus, Mars and comets -- none of which is protected by a global magnetic field -- the solar wind drapes around the objects themselves, interacting directly with their atmospheres (or in the comet's case, its coma). Cassini saw the same thing at Titan.

Researchers thought they would have to treat Titan's response to the solar wind with a unique approach because the chemistry of the hazy moon's dense atmosphere is highly complex. But Cassini's observations of a naked Titan hinted at a more elegant solution. "This could mean we can use the same tools to study how vastly different worlds, in different parts of the solar system, interact with the wind from the sun," Bertucci said.

Bertucci noted that the list of similarly unmagnetized bodies might include the dwarf planet Pluto, to be visited this year for the first time by NASA's New Horizons spacecraft.

"After nearly a decade in orbit, the Cassini mission has revealed once again that the Saturn system is full of surprises," said Michele Dougherty, principal investigator of the Cassini magnetometer at Imperial College, London. "After more than a hundred flybys, we have finally encountered Titan out in the solar wind, which will allow us to better understand how such moons maintain or lose their atmospheres."

The new research is published today in the journal Geophysical Review Letters.

The Cassini-Huygens mission is a cooperative project of NASA, the European Space Agency and the Italian Space Agency. NASA's Jet Propulsion Laboratory, a division of the California Institute of Technology in Pasadena, manages the mission for NASA's Science Mission Directorate, Washington, D.C. JPL designed, developed and assembled the Cassini orbiter. The magnetometer team is based at Imperial College, London, U.K.

Source: Nasa

NASA Study Finds Earth’s Ocean Abyss Has Not Warmed

While the upper part of the world’s oceans continue to absorb heat from global warming, ocean depths have not warmed measurably in the last decade. This image shows heat radiating from the Pacific Ocean as imaged by the NASA’s Clouds and the Earth's Radiant Energy System instrument on the Terra satellite. (Blue regions indicate thick cloud cover.) Image Credit: NASA
The cold waters of Earth’s deep ocean have not warmed measurably since 2005, according to a new NASA study, leaving unsolved the mystery of why global warming appears to have slowed in recent years.

Scientists at NASA's Jet Propulsion Laboratory (JPL) in Pasadena, California, analyzed satellite and direct ocean temperature data from 2005 to 2013 and found the ocean abyss below 1.24 miles (1,995 meters) has not warmed measurably. Study coauthor Josh Willis of JPL said these findings do not throw suspicion on climate change itself.

"The sea level is still rising," Willis noted. "We're just trying to understand the nitty-gritty details."

In the 21st century, greenhouse gases have continued to accumulate in the atmosphere, just as they did in the 20th century, but global average surface air temperatures have stopped rising in tandem with the gases. The temperature of the top half of the world's oceans -- above the 1.24-mile mark -- is still climbing, but not fast enough to account for the stalled air temperatures.

Many processes on land, air and sea have been invoked to explain what is happening to the "missing" heat. One of the most prominent ideas is that the bottom half of the ocean is taking up the slack, but supporting evidence is slim. This latest study is the first to test the idea using satellite observations, as well as direct temperature measurements of the upper ocean. Scientists have been taking the temperature of the top half of the ocean directly since 2005, using a network of 3,000 floating temperature probes called the Argo array.

"The deep parts of the ocean are harder to measure," said JPL's William Llovel, lead author of the study published Sunday in the journal Nature Climate Change. "The combination of satellite and direct temperature data gives us a glimpse of how much sea level rise is due to deep warming. The answer is -- not much."
Deep sea creatures, like these anemones at a hydrothermal vent, are not yet feeling the heat from global climate change. Although the top half of the ocean continues to warm, the bottom half has not increased measurably in temperature in the last decade. Image Credit: NERC
The study took advantage of the fact that water expands as it gets warmer. The sea level is rising because of this expansion and the water added by glacier and ice sheet melt.
To arrive at their conclusion, the JPL scientists did a straightforward subtraction calculation, using data for 2005-2013 from the Argo buoys, NASA's Jason-1 and Jason-2 satellites, and the agency’s Gravity Recovery and Climate Experiment (GRACE) satellites. 
From the total amount of sea level rise, they subtracted the amount of rise from the expansion in the upper ocean, and the amount of rise that came from added meltwater. The remainder represented the amount of sea level rise caused by warming in the deep ocean.
The remainder was essentially zero. Deep ocean warming contributed virtually nothing to sea level rise during this period.

Coauthor Felix Landerer of JPL noted that during the same period warming in the top half of the ocean continued unabated, an unequivocal sign that our planet is heating up. Some recent studies reporting deep-ocean warming were, in fact, referring to the warming in the upper half of the ocean but below the topmost layer, which ends about 0.4 mile (700 meters) down.

Landerer also is a coauthor of another paper in the same journal issue on 1970-2005 ocean warming in the Southern Hemisphere. Before Argo floats were deployed, temperature measurements in the Southern Ocean were spotty, at best. Using satellite measurements and climate simulations of sea level changes around the world, the new study found the global ocean absorbed far more heat in those 35 years than previously thought -- a whopping 24 to 58 percent more than early estimates.

Both papers result from the work of the newly formed NASA Sea Level Change Team, an interdisciplinary group tasked with using NASA satellite data to improve the accuracy and scale of current and future estimates of sea level change. The Southern Hemisphere paper was led by three scientists at Lawrence Livermore National Laboratory in Livermore, California.

NASA monitors Earth's vital signs from land, air and space with a fleet of satellites and ambitious airborne and ground-based observation campaigns. NASA develops new ways to observe and study Earth's interconnected natural systems with long-term data records and computer analysis tools to better see how our planet is changing. The agency shares this unique knowledge with the global community and works with institutions in the United States and around the world that contribute to understanding and protecting our home planet.

Source: Nasa

Scientists call for soil mapping program to help Indian agriculture

Written By Unknown on Wednesday, January 28, 2015 | 6:57 PM

Delegates to the University's agriculture workshop at Kharagpur
Scientists attending an agriculture workshop in India organised by the University of Sydney have called for a detailed soil mapping program to help policy makers and farmers draw up effective land management proposals.

The Soil and Water National Networking Workshop, organised jointly with the Indian Institute of Technology at Kharagpur, involved 40 scientists from India and Australia.

They discussed key issues including soil security, digital soil mapping, India's participation in the Global Soil Map project, national level spectral libraries, soil data requirement in crop simulations, soil health mapping, hydrological model behaviour, and using soil digital and satellite data for hydrologic models.

A number of speakers urged India to participate in the Global Soil Map and accelerate the provision of fine scale information on soil fertility and conditions in India. The information could also be used to monitor and understand the change over time in soil nutrients.

The workshop's soil group was led by Professor Budiman Minasny, Professor Bhabani Das and Dr Kanika Singh from the University of Sydney. The hydrology group was led by A/Professor Willem Vervoort from Sydney, Dr Rajib Maity and Mr Dipangkar Kundu.

The workshop was launched with a welcome video by Professor Alex McBratney, the Dokuchaev award winner in Soil Science, who is actively involved with the Global Soil Map.

Dr Singh said: "The workshop was a great success; the Indian scientists showcased high quality research and are open to future collaboration in the Global Soil Map effort.

"The director of IIT Kharagpur in his speech talked about a joint collaboration between India and Australia for a comprehensive digitisation of soil information contributing to soil security and sustainable productivity. The Assistant Director General of the Indian Council of Agricultural Research is also keen to developIndian collaboration in the Global Soil Map effort.

"We look forward to long-term collaboration with IIT Kharagpur and other such organisations in India to achieve collaborative research."

The workshop was sponsored by the Australia-India Council.

Contact: Richard North
Phone: 02 9351 3191
Email: richard.north@sydney.edu.au

 Source: THE UNIVERSITY OF SYDNEY

Stanford scientists use ocean waves to monitor offshore oil and gas fields

A new technique for passively probing the sea floor using weak seismic waves generated by the ocean was tested at the Ekofisk oil field in the North Sea. 
A technology developed by Stanford scientists for passively probing the seafloor using weak seismic waves generated by the ocean could revolutionize offshore oil and natural gas extraction by providing real-time monitoring of the subsurface while lessening the impact on marine life.

"We've shown that we can generate images of the subsurface nearly every day instead of taking snapshots just two or three times a year," said Biondo Biondi, professor of geophysics at Stanford's School of Earth Sciences.

Currently, many energy companies use a technique called time-lapse reflection seismology to monitor offshore oil and gas deposits to optimize production and look for hazards such as hidden gas pockets. Reflection seismology involves ships towing arrays of "air guns" that explode every 10 to 15 seconds to produce loud sound pulses. The pulses bounce off the seafloor and geological formations beneath, then journey back to the surface, where they are recorded by hydrophones. The data are then deciphered to reveal details about subsurface structures.

Each survey can cost tens of millions of dollars, and as a result they are only conducted two to three times a year. Environmental groups and marine biologists have expressed concerns about the use of air guns for contributing to noise pollution in the ocean that can disturb or even injure marine animals, including humpback whales and giant squid.

The new technique developed by Biondi and Sjoerd de Ridder, a student of Biondi's who is now a postdoctoral scientist at the University of Edinburgh, is different. It exploits naturally occurring seismic waves generated by Earth's oceans that are several orders of magnitude weaker than those produced by earthquakes.

Ambient seismicity

As ocean waves collide with one another, they create pressures on the sea floor, where they generate seismic waves that then propagate in every direction. Scientists have known about this "ambient seismic field" for nearly a century, but it was only recently that they understood ways to harness it.

"We knew the ambient seismic energy was there, but we didn't know what we could do with it," De Ridder said. "That understanding has only been developed in recent years. Our technique provides the first large-scale application to harness it for oil and gas production."

The technique that Biondi and De Ridder developed, called ambient seismic field noise-correlation tomography, or ASNT, uses sensors embedded in the seafloor. The sensors, which are typically installed by robotic submersibles, are connected to one another by cables and arranged into parallel rows that can span several kilometers of the seafloor. Another cable connects the sensor array to a platform in order to collect data in real time.

The sensors record ambient seismic waves traveling through Earth's crust. The waves are ubiquitous, continuously generated and traveling in every direction, but using careful signal-processing schemes they developed, Biondi and De Ridder can digitally isolate only those waves that are passing through one sensor and then another one downstream. When this is done repeatedly, and for multiple sensors in the network, what emerges is a "virtual" seismic wave pattern that is remarkably similar to the kind generated by air guns.

Less disruptive

Because the ASNT technique is entirely passive, meaning it does not require a controlled explosion or a loud air gun blast to create a seismic wave signature, it can be performed for a fraction of the cost of an active-reflection-seismology survey and should be far less disruptive to marine life, the scientists say.

Since 2007, Biondi and De Ridder have been testing and refining their technique in a real-world laboratory in Europe. The scientists worked with the energy companies BP and ConocoPhillips to study recordings from existing sensor arrays in the Valhall and Ekofisk oil fields in the North Sea that are capable of recording ambient seismic waves.

The proof-of-concept experiment has been successful, and the scientists have demonstrated that they can image the subsurface at Valhall down to a depth of nearly 1,000 feet. "We've now shown that our technique can very reliably and repeatedly retrieve an image of the near-surface," De Ridder said. "Our hope is that they can also reveal changes in the rocks that could signal an impending problem."

Source: Stanford

Still hot inside the Moon: Tidal heating in the deepest part of the lunar mantle

Written By Unknown on Sunday, January 4, 2015 | 5:10 AM

This is an artist's conception of internal structure of the Moon based on this science result.
Credit: Image courtesy of National Astronomical Observatory of Japan
An international research team, led by Dr. Yuji Harada from Planetary Science institute, China University of Geosciences, has found that there is an extremely soft layer deep inside the Moon and that heat is effectively generated in the layer by the gravity of Earth.

The results were derived by comparing the deformation of the Moon as precisely measured by Kaguya (SELENE, Selenological and Engineering Explorer) and other probes with theoretically calculated estimates. These findings suggest that the interior of the Moon has not yet cooled and hardened, and also that it is still being warmed by the effect of Earth on the Moon. This research provides a chance to reconsider how both Earth and the Moon have been evolving since their births through mutual influence until now.

When it comes to clarifying how a celestial body like a planet or a natural satellite is born and grows, it is necessary to know as precisely as possible its internal structure and thermal state. How can we know the internal structure of a celestial body far away from us? We can get clues about its internal structure and state by thoroughly investigating how its shape changes due to external forces. The shape of a celestial body being changes by the gravitational force of another body is called tide. For example, the ocean tide on Earth is one tidal phenomenon caused by the gravitational force between the Moon and the Sun, and Earth. Sea water is so deformable that its desplacement can be easily observed. How much a celestial body can be deformed by tidal force, in this way, depends on its internal structure, and especially on the hardness of its interior. Conversely, it means that observing the degree of deformation enables us to learn about the interior, which is normally not directly visible to the naked eye.

The Moon is no exception; we can learn about the interior of our natural satellite from its deformation caused by the tidal force of Earth. The deformation has already been well known through several geodetic observations (*1). However, models of the internal structure of the Moon as derived from past research could not account for the deformation precisely observed by the above lunar exploration programs.

Therefore, the research team performed theoretical calculations to understand what type of internal structure of the Moon leads to the observed change of the lunar shape.
What the research team focused on is the structure deep inside the Moon. During the Apollo program, seismic observations (*2) were carried out on the Moon. One of the analysis results concerning the internal structure of the Moon based upon the seismic data indicates that the satellite is considered to consist mainly of two parts: the "core," the inner portion made up of metal, and the "mantle," the outer portion made up of rock. The research team has found that the observed tidal deformation of the Moon can be well explained if it is assumed that there is an extremely soft layer in the deepest part of the lunar mantle. The previous studies indicated that there is the possibility that a part of the rock at the deepest part inside the lunar mantle may be molten. This research result supports the above possibility since partially molten rock becomes softer. This research has proven for the first time that the deepest part of the lunar mantle is soft, based upon the agreement between observation results and the theoretical calculations.

Furthermore, the research team also clarified that heat is efficiently generated by the tides in the soft part, deepest in the mantle. In general, a part of the energy stored inside a celestial body by tidal deformation is changed to heat. The heat generation depends on the softness of the interior. Interestingly, the heat generated in the layer is expected to be nearly at the maximum when the softness of the layer is comparable to that which the team estimated from the above comparison of the calculations and the observations. This may not be a coincidence. Rather, the layer itself is considered to be maintained as the amount of the heat generated inside the soft layer is exquisitely well balanced with that of the heat escaping from the layer. Whereas previous research also suggests that some part of the energy inside the Moon due to the tidal deformation is changed to heat, the present research indicates that this type of energy conversion does not uniformly occur in the entire Moon, but only intensively in the soft layer. The research team believes that the soft layer is now warming the core of the Moon as the core seems to be wrapped by the layer, which is located in the deepest part of the mantle, and which efficiently generates heat. They also expect that a soft layer like this may efficiently have warmed the core in the past as well.

Concerning the future outlook for this research, Dr. Yuji Harada, the principle investigator of the research team, said, "I believe that our research results have brought about new questions. For example, how can the bottom of the lunar mantle maintain its softer state for a long time? To answer this question, we would like to further investigate the internal structure and heat-generating mechanism inside the Moon in detail. In addition, another question has come up: how has the conversion from the tidal energy to the heat energy in the soft layer affected the motion of the Moon relative to the Earth, and also the cooling of the Moon? We would like to resolve those problems as well so that we can thoroughly understand how the Moon was born and has evolved."

Another investigator, Prof. Junichi Haruyama of Institute of Space and Aeronautical Science, Japan Aerospace Exploration Agency, mentioned the significance of this research, saying, "A smaller celestial body like the Moon cools faster than a larger one like the Earth does. In fact, we had thought that volcanic activities on the Moon had already come to a halt. 

Therefore, the Moon had been believed to be cool and hard, even in its deeper parts. However, this research tells us that the Moon has not yet cooled and hardened, but is still warm. It even implies that we have to reconsider the question as follows: How have the Earth and the Moon influenced each other since their births? That means this research not only shows us the actual state of the deep interior of the Moon, but also gives us a clue for learning about the history of the system including both the Earth and the Moon."

The scientific paper on which this article is based appears in the Nature Geoscience.

Strong tidal heating in an ultralow-viscosity zone at the core-mantle boundary of the Moon.
Note:
*1: Geodetic observation. (This is also called "selenodetic" observation as it is for the Moon.)
Observational results on gravity and rotation of the Moon are used in this research. Precise measurements of the lunar gravity and rotation enable us to know how our natural satellite is deformed by tidal forces.

The gravity of the Moon can be measured by tracking the motion of a satellite orbiting the Moon. This is because the motion of the satellite is influenced by lunar gravity. The motion of the satellite orbiting the Moon can be determined by using radio waves between the Earth and the satellite, and between multiple satellites around the Moon. The gravity of the Moon changes when it deforms due to tidal forces. The change in gravity caused by the lunar deformation due to the tidal force is extremely small, but when the change in location of the orbiter can be determined precisely enough, it is possible to accurately detect the change in lunar gravity caused by the deformation due to the tidal force. During the last several years, the degree of the lunar deformation caused by the tidal forces has been determined by several orbiters, for example, Kaguya from Japan, Chang'e-1 from China, and Lunar Reconnaissance Orbiter (LRO) and Gravity Recovery and Interior Laboratory (GRAIL) from the USA.

The rotation of the Moon can be observed by monitoring the change in position of a kind of mirror placed in several locations on the lunar surface. The same side of the Moon is almost always facing the Earth, but strictly speaking, it changes by a slight amount according to the lunar orbit around the Earth. This means that the locations of the mirrors with respect to the Earth also changes over time. If this change in position is precisely measured, it can also be determined how the direction of the lunar axis changes. This slight change of direction also depends on the deformation caused by the tidal force. It can be seen, therefore, how the Moon deforms due to the tidal force once the change in the axis is measured precisely. Some of the above-mentioned mirrors have been left on the surface of the Moon in the framework of the lunar exploration programs led by the USA or the former USSR several decades ago, such as the Apollo program. The degree of change in the location of each mirror on the Moon can be determined by using laser beams emitted from the Earth. This experiment still continues to be carried out even today.

*2: Seismic observation. (Quakes on the Moon are also called "moonquakes." )

There are seismic activities not only on the Earth, but also on the Moon. As part of the Apollo program in the past, seismometers were placed on the lunar surface for seismological measurements. Waves induced by quakes measured with seismometers suggest what the internal structure of a celestial body is like. The behavior of the seismic waves is very important for understanding how the hardness inside the celestial body will change in accordance with the depth. In particular, the present research considered the following two previous analysis results in order to theoretically calculate the lunar deformation caused by the tidal force.

The first one is the existence of the area deep inside the Moon where the seismic waves become drastically weaker. It is generally known that the energy of the seismic waves tends to reduce more in softer solids, especially when they contain liquids. Therefore, the deepest part of the lunar mantle is softer than the shallower part. Also, a portion of the rocks is thought to be melted.

The second one is the existence of areas deep inside the Moon whose interfaces reflect the 
seismic waves. Three boundaries are considered to exist. Two of them are like the ones in the Earth: one separating the solid inner core and the liquid outer core, and the other one separating the outer core and the mantle. The last boundary is considered to correspond to the one in the mantle separating the solid area and the partially molten area mentioned above.

Source: National Astronomical Observatory of Japan
 
Support : Creating Website | Johny Template | Mas Template
Copyright © 2011. The planet wall - All Rights Reserved
Template Created by Easy Blogging Published by Mas Template
Proudly powered by Blogger